Market Insights 7/13/26
Observations & Insights – July 13, 2026
3Rd Saturday Cars & Coffee is this week (7/18/26)
10am to Noon @ 6385 Corporate Dr. 80919
Markets Rally
The S&P 500 finished more than 1% higher and the NASDAQ added nearly 2% as the indexes recorded their second positive week in a row. Stocks have largely alternated between modest gains and losses since early June as investors assess AI-related spending, the Middle East conflict, and elevated oil prices.
Key Points
- Markets rallied last week with the Dow hitting an all-time high Monday.
- Earnings are expected to grow over 20% from the Q2 of last year as season begins this week.
- Markets had a strong first half, this is a positive sign for the remainder of the year.
- We remain bullish but continue to diversify.
Observations: Dow Hits Record, Earnings On-Deck
Wall Street analysts modestly boosted their expectations as major U.S. banks prepared to open quarterly earnings season. As of Friday, analysts surveyed by FactSet were forecasting an average second-quarter earnings growth rate of 23.6% for companies in the S&P 500, up from a 23.3% forecast a week earlier. Either outcome would mark the second consecutive quarter of growth exceeding 20%.
Prices of U.S. government bonds fell for the second week in a row, sending yields to their highest levels since mid-May amid persistent concerns about inflation and interest rates. The 10-year Treasury yield finished the week at 4.56%, up from 4.37% a couple of weeks earlier. The 30-year Treasury ended at 5.06%, up from 4.87% two weeks earlier.
The Dow on Monday closed at 53,055.9, pushing the previous week’s record level higher. But the 30-stock index couldn’t maintain positive momentum, as it fell on Tuesday and Wednesday and finished 0.5% lower for the week. The S&P 500 finished a half percentage point below the record that it set on June 2; the NASDAQ was more than 3% below the record it set on the same date.
Oil prices jumped on Tuesday and Wednesday as an escalation in the Middle East conflict reinforced the fragility of a U.S.-Iran ceasefire agreement. The price of U.S. crude briefly climbed to about $76 per barrel on Wednesday before pulling back to around $71 by Friday afternoon.
An index that tracks investors’ expectations of short-term U.S. stock market volatility fell for the second week in a row, slipping to its lowest level in more than six months. The CBOE Volatility Index (VIX) finished the week at 15.0, down from a recent high of 22.2 reached on June 10.
A U.S. small-cap index lagged its large-cap peer by a big margin for the week, eroding small caps’ year-to-date outperformance. The Russell 2000 Index fell 0.6% for the week while its large-cap counterpart ended 1.0% higher.
The new week’s calendar will be packed, as recently installed U.S. Federal Reserve Chair Kevin Warsh is scheduled to testify before House and Senate panels on Tuesday and Wednesday, respectively, and present a monetary policy update. In addition, a U.S. Consumer Price Index report scheduled for release on Tuesday will provide a monthly update on inflation.
Insights: More Reasons to Remain Bullish (Mid-Year Update)
“Someone will always be getting richer faster than you. This is not a tragedy.” Charlie Munger
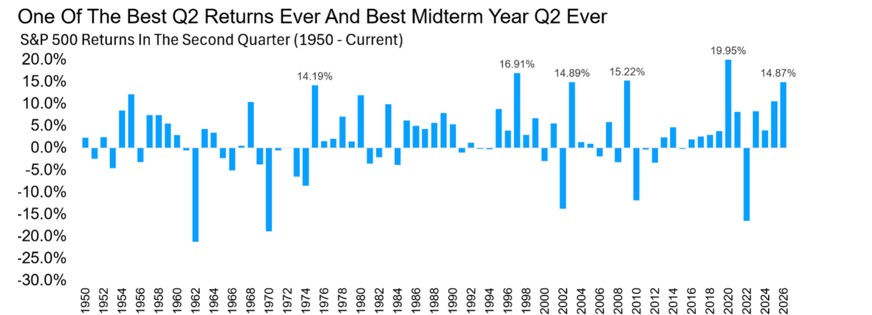
Well, that’s a wrap on the first half of 2026. After all the hand wringing this spring over the Middle East, oil prices, and the Fed, the S&P 500 closed the first six months up a solid 9.6% (excluding dividends). The index’s second quarter gain of 14.9% was the best Q2 in a midterm year we have ever seen and the fifth-best Q2 of any year since 1950.
Source: FactSet
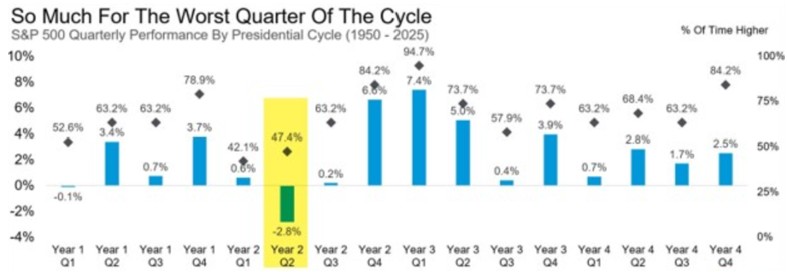
So Much for the Worst Quarter of the Cycle
If you break the four-year presidential cycle into 16 quarters, Q2 of the midterm year has historically been the single worst of the bunch for the S&P 500, down 2.8% on average and higher less than half the time. This makes the nearly 15% gain this year all the more impressive.
Source: FactSet
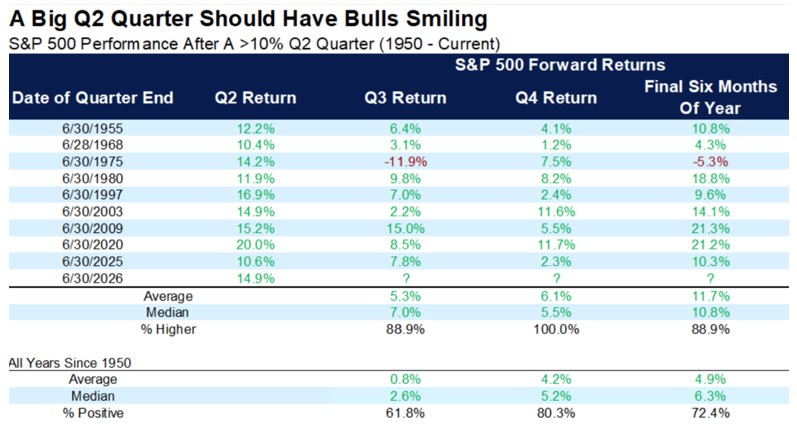
A Big Q2 Should Have Bulls Smiling
A monster quarter like this often begets more strength historically, not less. We found nine other times the S&P 500 gained double digits in Q2, and the forward numbers are about as good as it gets: Q3 was lower only once, and Q4 was never lower. Even better, the final six months of the year averaged a gain of 11.7%, more than double the 4.9% you get in an average year. Big up quarters are not something to fear. Historically, they have been a sign the trend has legs.
Source: FactSet
Source: FactSet
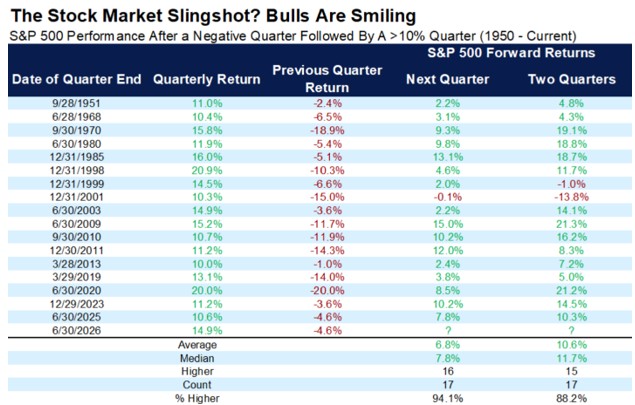
Bulls Play With Slingshots
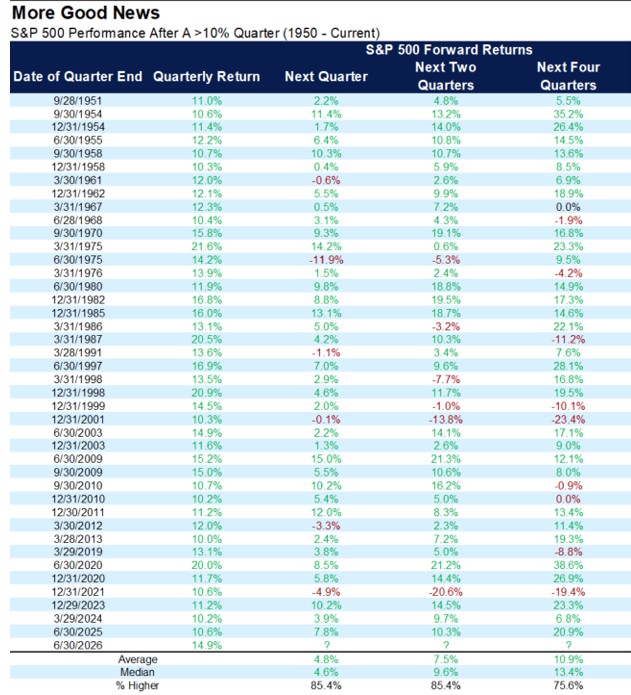
Adding to the concepts above, in Q1 the S&P 500 was down close to 5%. That might feel like years ago at this point, but it is true—2026 actually had a rough start.
We found 17 times there was a greater than 10% quarter that followed a negative quarter and boy, bulls will like this one.
The next quarter was higher 16 times and two quarters later gained 15 times, with some very big returns mixed in there. The bottom line, this is yet another reason to expect the bulls may have some fun the rest of 2026.
Source: FactSet
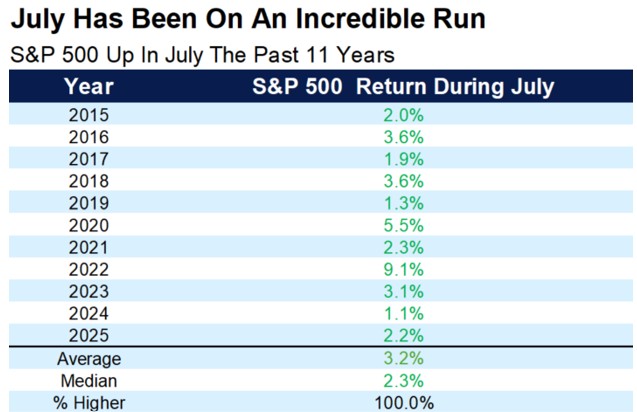
July Is Here, and It’s Been on a Heater
Can you believe the year is already half over? More good news for the bulls: July has become one of the best months on the calendar. The S&P 500 has been higher in July an incredible 11 years in a row and 13 out of 14 years, and thanks to that streak, no month has a better average return over the past 20 years. Pick your reason, but July has been especially kind under President Trump, higher all five times (five for five) for an average gain of 2.9%.
Source: FactSet
The Sweet Spot for the Rest of the Year?
We flagged this one last year, and it worked, so we are running it back. When the S&P 500 is up between 5% and 10% year to date at the midpoint of the year (right about where we sit now), the second half tends to do quite well, higher nearly 88% of the time.
It is not the strongest setup in the world, but it is far from weak: the worst full-year outcome from here was exactly flat (2011), so a large decline from these levels would be historically rare. Not too hot, not too cold. Another reason we are comfortable continuing to ride the wave in 2026, while staying diversified for whatever the second half decides to throw at us.
Source: FactSet
Final Thoughts
Thanks as always for reading. This year has not always been easy, with many worries and scary headlines out there. Yet, a 10% return the first half of the year is impressive, and we do not think the ride is over just yet.
It is our aim at Asbury Wealth Partners that you find the market commentary we provide informative and useful. As our success grows mainly through referrals from our clients, we encourage you to share this weekly newsletter with your friends, family, and colleagues. If you are a client, we thank you for your business and your confidence. If you are not yet a client, we encourage you to contact us today and explore how our team may be able to add value to your unique financial situation.
Thank You,
Jeff
~~~~~~~~~~~~~~~~~~~~~~~
Jeffrey S. Markewich
Wealth Advisor
Off – 719-548-8103
Cell - 719-357-7747
Text – 702-493-9678
TF - 888-328-7655
~~~~~~~~~~~~~~~~~~~~~~~
An Introduction to Your Friends & Family
is the Greatest Compliment You Can Give
Jeffrey Markewich is a Registered Representative with, and securities and advisory services offered through LPL Financial, a registered investment advisor, Member FINRA/SIPC.
The information contained in this email message is being transmitted to and is intended for the use of only the individual(s) to whom it is addressed. If the reader
of this message is not the intended recipient, you are hereby advised that any dissemination, distribution or copying of this message is strictly prohibited. If you have received this message in error, please reply and you will be removed.
These views are those of the author, not of the broker-dealer or its affiliates. This material contains an assessment of the market and economic environment at a specific point in time and is not intended to be a forecast of future events, or a guarantee of future results. All investments involve risk, including loss of principal. Forward-looking statements are subject to certain risks and uncertainties. Actual results, performance, or achievements may differ materially from those expressed or implied. Information is based on data gathered from what we believe are reliable sources.
The opinions voiced in this material are for general information only and are not intended to provide specific advice or recommendations for any individual. All performance referenced is historical and is no guarantee of future results. All indices are unmanaged and may not be invested into directly.
The NASDAQ Composite Index measures all NASDAQ domestic and non-U.S. based common stocks listed on The NASDAQ Stock Market. The market value, the last sale price multiplied by total shares outstanding, is calculated throughout the trading day, and is related to the total value of the Index.
S&P 500 – A capitalization-weighted index of 500 stocks designed to measure performance of the broad domestic economy through changes in the aggregate market value of 500 stocks representing all major industries.
The Dow Jones Industrial Average is comprised of 30 stocks that are major factors in their industries and widely held by individuals and institutional investors.
The Russell 2000 Index is an unmanaged index generally representative of the 2,000 smallest companies in the Russell 3000 index, which represents approximately 10% of the total market capitalization of the Russell 3000 Index.
The CBOE Volatility Index? (VIX?) is meant to be forward looking, showing the market's expectation of 30-day volatility in either direction, and is considered by many to be a barometer of investor sentiment and market volatility, commonly referred to as “Investor Fear Gauge”.
International investing involves special risks such as currency fluctuation and political instability and may not be suitable for all investors.
All indexes referenced are unmanaged. The volatility of indexes could be materially different from that of a client’s portfolio. Unmanaged index returns do not reflect fees, expenses, or sales charges. You cannot invest directly in an index. Consult your financial professional before making any investment decision.
There is no guarantee that a diversified portfolio will enhance overall returns or outperform a non-diversified portfolio. Diversification does not protect against market risk.
Asset allocation does not ensure a profit or protect against a loss.
The Consumer Price Indexes (CPI) program produces monthly data on changes in the prices paid by urban consumers for a representative basket of goods and services (Source: U.S. Department of Labor).
The Gross Domestic Product (GDP) is a comprehensive measure of U.S. economic activity. GDP measures the value of the final goods and services produced in the United States (without double counting the intermediate goods and services used up to produce them). Changes in GDP are the most popular indicator of the nation's overall economic health.
Government bonds and Treasury bills are guaranteed by the US government as to the timely payment of principal and interest and, if held to maturity, offer a fixed rate of return and fixed principal value.
LPL Tracking # 1139063