


Market Insights - 06/29/26
Observations & Insights – June 29, 2026
Happy 250th Birthday, America!
Hope you and your family have a nice celebration.
Markets Get Defensive
Shares of semiconductor stocks fell, and several traditionally defensive sectors outperformed, leading to sharply divergent weekly returns across U.S. indexes. The Dow finished 0.6% higher, the NASDAQ dropped -4.6%, and the S&P 500 ended -2% lower. For the latter index, it was just the second negative result out of the past 13 weeks.
Key Points
- Broad stock indexes move lower in a volatile week.
- The US economy grew at a 2.1% annualized rate.
- Inflation rose to a 4.1% annualized rate.
- Bubble or not, we are (still) riding the wave.
Observations: Growth Rises, But So Does Inflation
The U.S. government’s updated estimate of first-quarter economic growth found that GDP expanded at a 2.1% annual rate, above an earlier estimate of 1.6%. The Commerce Department said its third and final update largely reflected a downward revision to imports, which subtract from GDP. That change offset the negative impact from a weakening in U.S. consumer spending.
A monthly report showed inflation running at its highest level in more than three years. Thursday’s Personal Consumer Expenditures Price Index report showed an annual rate of 4.1% in May, in line with most economists’ expectations. Excluding food and energy prices, May’s core PCE inflation was 3.4%.
An index of U.S. large-cap growth stocks lagged its value counterpart by a big margin, widening the value equity style’s year-to-date outperformance. The growth index ended 3.2% lower for the week while the value index posted a 0.2% gain. Year to date, the growth index was up just 0.1% versus a 14.4% gain for its value peer.
Oil prices fell to their lowest levels in about four months as Middle East tensions continued to ease. On Friday, U.S. crude was trading around $69 per barrel, down about -9% for the week and well below the $100+ levels seen in mid-May. On a year-to-date basis, however, oil was up about 20% based on Friday’s price.
The price of the most widely traded cryptocurrency briefly fell below $59,000 on Thursday, the lowest level since September 2024. As of Friday afternoon, Bitcoin had recovered some of its latest losses and was trading around $60,000. The cryptocurrency remained well below a recent peak of around $82,000, reached on May 10 and a record high of $126,000, set last October.
A gauge of U.S. consumer sentiment improved amid moderating gasoline prices, snapping a three-month streak of declines that had left sentiment at record lows. The University of Michigan’s survey results showed that sentiment rose to a final June reading of 49.5 from May’s 44.8 figure. Consumers’ long-run inflation expectations fell to 3.3% in June from 3.9% in May.
A jobs report due out on Thursday, in advance of Friday’s pre-holiday market closure, will show whether recent strengthening in the labor market extended into June. In May, job growth surpassed economists’ consensus expectations for the third month in a row, with 172,000 jobs added.
Insights: How I’m Learning to Stop Worrying and Love the Bubble
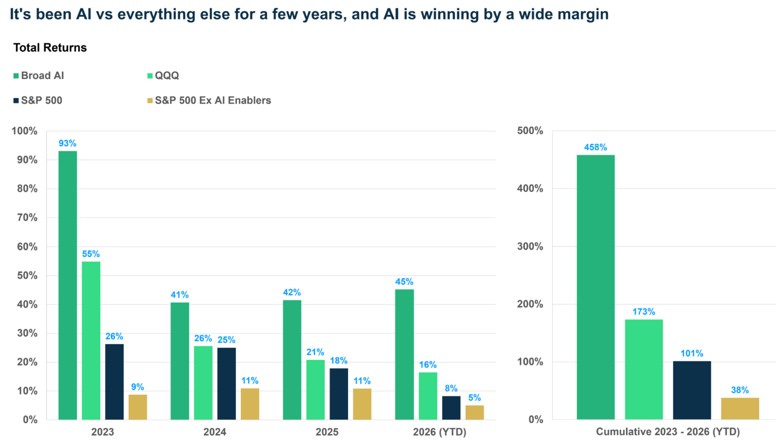
There I said it, the word “bubble.” To be honest, I do not really know if we are in the middle of a bubble, and certainly not when it might burst if we are. But I do believe we will look back on this period several years from now and recognize it as a bubble. There is clearly something huge happening right now with AI, with potentially significant technological transformation for the economy and a huge impact on markets. On the markets front, AI is clearly on a massive run: here is a comparison of a basket of AI stocks versus the S&P 500 and the S&P 500 excluding AI-related stocks. I have also included the QQQ ETF as an AI-adjacent reference. Since 2023, shortly after ChatGPT was released, AI-related stocks have raced ahead of everything else.
From January 1, 2023, through June 23, 2026:
- Broad AI (Goldman Sachs US Broad AI Index): 458%
- QQQ: 173%
- S&P 500: 101%
- S&P 500 ex AI (Goldman Sachs S&P 500 ex AI Enablers Index): 38%
Source: Bloomberg
These sorts of return differentials raise bubble concerns. Valuations typically tend to be the more popular indicator of a bubble, but valuations can remain stretched for a long time. The CAPE ratio (cyclically adjusted P/E ratio, with earnings averaged over the prior 10 years) is currently at 41, more than 3 standard deviations above its long-term average of 18 (since 1880). At the same time, it has been above 2 standard deviations for over 2 years now, and above the 1-standard deviation level for over a decade.
Source: Robert Schiller
At the same time, if you look at P/E ratios using next 12-month EPS, the current level of 20.9x is just 1 standard deviation above its average level (1995-2025). That is far from the stretched levels we see when looking at the CAPE ratio.
Source: S&P
This is a result of corporate profits growing well above their long-term trend, and analysts projecting strong growth ahead as a result. Next 12-month EPS estimates are going almost vertical.
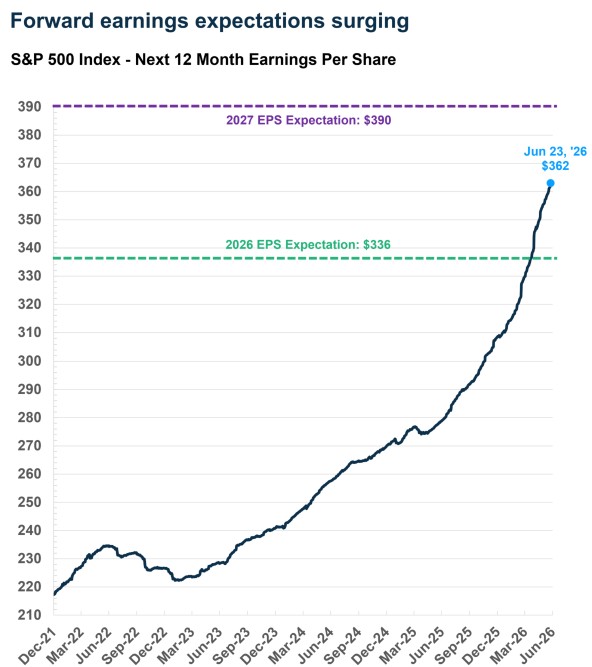
Source: FactSet
The S&P 500 has doubled since the end of 2022 (+101% return), and only 26%-points of that can be attributed to multiple expansion (valuations becoming more expensive). Profit growth contributed 66%-points, while dividends added almost 10% points to the total return. Incredibly, this is not just a story of sales growth. Profit growth was almost equally split between sales growth (+35%-points) and margin expansion (+31%-points).
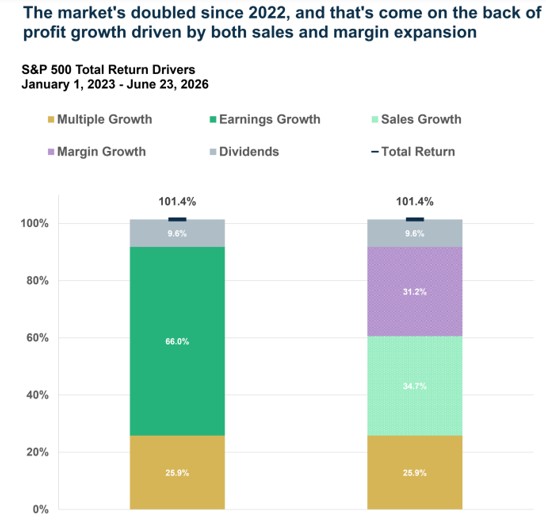
Source: FactSet
Bubble Watch: Extreme Price Dispersion
Rather than focus on valuations, which depend on the kind of measure you are looking at, I lean toward looking at price-based measures for potential signs of a bubble. And even economic data. And right now, several numbers look quite stretched.
One thing you see during bubbles is momentum outperforming the broad index by a lot. The S&P 500 Momentum Index is up 30% YTD versus an 8.2% return for the S&P 500 (as of June 23). No surprise, this is on the back of AI-related exposure, with technology making up almost 55% of the momentum basket.
The top 5 names have all outperformed the S&P 500 this year, and make up almost 40% of the basket:
- Micron at a 12% weight (+268.7% YTD)
- NVIDIA at an 8% weight (+7.4% YTD)
- Alphabet at an 8% weight (+10.4% YTD)
- Broadcom at a 7% weight (+10.2% YTD)
- Lam Research at a 4% weight (+117% YTD)
Further down the list you have stocks like AMD (+142.7% YTD), Intel (+258% YTD), and Sandisk (+727% YTD).
Here is a historical perspective as to how strong momentum is. I compared the current excess return for the S&P 500 Momentum Index relative to the S&P 500 and looked at the percentile rank relative to the last 40 years, both on a 1-year rolling basis, and 3-years.
Over the last 1-year:
- S&P 500 Momentum: +37.2%
- S&P 500: +19.3%
- Excess return: +17.9%
- Percentile rank: 94th
It’s even more extended if you look at the last three years:
- S&P 500 Momentum: +40.1% (annualized)
- S&P 500: +18.5%
- Excess return: +21.6%
- Percentile rank: 99th
That is as extreme as it gets, and almost as high as it got back in March 2000 (the peak of the dot com bubble). Of course, it could go further (and remain in the 99th – 100th percentile), but usually a pullback beckons.
Source: Bloomberg
Along these lines, dispersion across stocks has also surged since April. We are seeing massive levels of return dispersion with AI excitement driving extreme price moves (including some of the stocks noted above). It is one thing for small-cap stocks to surge 50% to 100% in a month, but highly unusual to see this in the large-cap space. Here is a chart showing monthly dispersion for the MSCI ACWI Index going back to January 1995. In this case, dispersion is the market cap weighted cross-sectional standard deviation of monthly returns across stocks in the index. As you can see, we are at the highest levels since 2000 and 2007.
Source: Acadian
The following table shows the five highest dispersion months from 1995 – 2026 (May). April/May 2026 were extraordinary, ranking below only December 1999 and February 2000. Today’s high dispersion does not merely reflect the market’s high concentration into a small number of names. We have had high concentration for several years now. But the high dispersion is new.
Source: Acadian
Of course, this is in large part because of the AI story playing out in places like South Korea and Taiwan as well.
- The MSCI South Korea Index is up 112% YTD and up 127% in local currency terms, driven by Samsung (+140.6%) and SK Hynix (+279.6%).
- The MSCI Taiwan Index is up 68% YTD and up 69% in local currency terms, driven by TSMC (+58%).
All this to say, be careful using international stocks to diversify AI exposure.
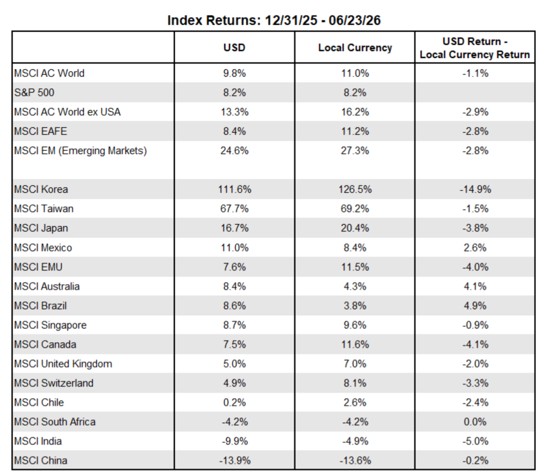
Source: FactSet
This high dispersion has an impact on active managers as well. Typically, high dispersion would offer potential for active managers to outperform. However, when you have these extreme levels of dispersion driven by just a few stocks, there is a big risk of underperformance if you do not hold those stocks. As a result, active managers reduce their active bets and more closely track their benchmarks, which means they buy names that may not otherwise buy based on “fundamentals.” This results in more buying pressure for these momentum stocks, as managers who are underweight these names buy them. Momentum begets momentum, and that can continue for a while — we do not have to see a reversal just because dispersion is really elevated.
Equity Supply Is Rising
Another thing you see during bubbles is a lot of equity supply. Over the past couple of decades, corporations were mostly reducing the supply of stocks (with stock buybacks). That has flipped as of Q1 2026, with net issuance turning positive – and that is likely to continue into Q2 and the rest of the year (especially with huge IPOs like SpaceX, Anthropic, and OpenAI). This is the first time since Q1 2021 that net issuance has turned positive, and we saw a similar net supply increase back in Q1 2000.
Source: Federal Reserve
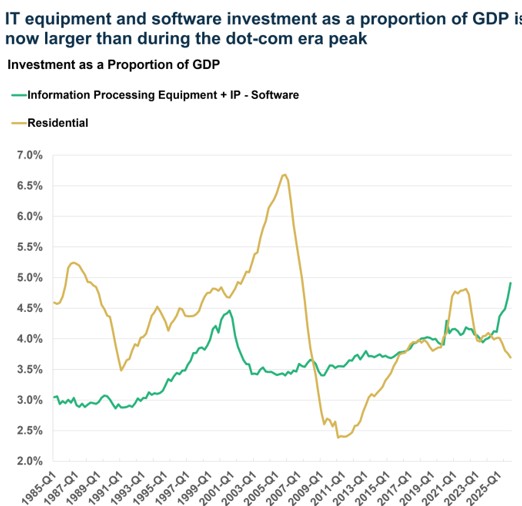
The Real Economy Is Also Feeling the AI Impact
If you look at the economy more broadly, AI is increasingly becoming a large part of it, including hardware and software. Investment in information processing equipment and software now makes up 4.9% of GDP, the highest proportion ever (it maxed at 4.5% in 2000). That is higher than residential investment right now (housing), though housing-related investment peaked at 6.7% of GDP in 2005 Q4.
The profit growth story of AI is essentially an investment story—one company’s investment spending is another company’s revenue and profits. So, any reversal of this investment spending will be a sign that optimism has peaked, and that profit growth is also easing. Note that residential investment started pulling back in 2006, well before the bust. (The S&P 500 peaked in October of 2026.)
Source: BEA
Inflation, in particular inflation for AI-related items, tells a similar story.
- The PCE inflation index for computers and software is up 83% annualized over the last three months (through April) and 14% year over year.
- PPI (Producer Price Index) for printed circuit board assembly manufacturing is up 224% annualized over the last three months (through May) and 155% year over year.
- PPI for semiconductor and other electronic component manufacturing is up 42% annualized over the last three months (through May) and 25% year over year.
These are flaming hot inflation numbers, but one person’s inflation is another company’s profits (and margin expansion). There is a reason why chip company profits are growing as fast as they are, and it also tells you that demand is outstripping supply right now. A reversal of these enormous price increases, or even a slowdown, will tell us that supply is catching up and overtaking demand even before consumers (and companies making the purchases) are no longer willing to pay up. And that will be a sign that we are on the other side.
Source: FRED
The massive increase in prices for technology-related items is also a sharp contrast to what we saw in the late 1990s. Back then, prices were dropping sharply across the board, whether it was hardware (including telecom equipment) or software.
How I Learned to Stop Worrying: The Secret to Investing in AI May Be to Diversify
We wrote about riding the AI wave in our 2026 Outlook, focusing on overweighting equities and taking advantage of momentum. But we also discussed avoiding a wipeout with appropriate diversification.
That’s obviously easier said than done right now, as AI is flowing to almost every corner of the market.
Even “Value” is Tied To AI
You would think AI is a “growth” story, but if you look at more popular baskets of “value” stocks, whether the traditional style box definition of value or a factor-based approach, they are not really lagging the S&P 500 by a significant amount, and in some cases, they are doing much better. Hear are some year-to-date total returns as of June 23, 2026:
- S&P 500 Value ETF (SPYV): +7.5%
- iShares Russell 1000 Value ETF (IWD): +15.4%
- iShares MSCI USA Value Factor (VLUE): +45.3%
- S&P 500: +8.2%
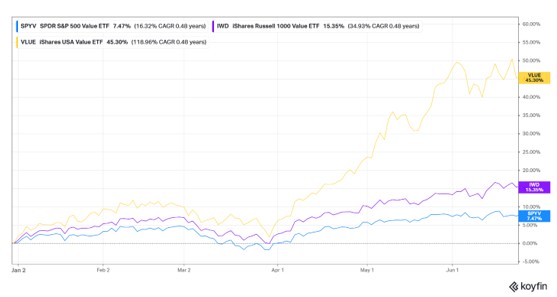
Source: Koyfin
Well, a big reason for this is that these baskets also have significant exposure to AI-related stocks.
- The largest sector within the S&P 500 Value ETF (SPYV) is technology (21%), with Apple making up over 7% of the basket (+8.5% YTD) and Intel making up over 2% (the stock is up 258% YTD).
- Amongst the largest names in the Russell 1000 Value ETF (IWD) are Alphabet at a 4% weight (+10% YTD), Micron at a 3.7% weight (+269% YTD), Intel at a 1.7% weight (+258% YTD), and Cisco at a 1.4% weight (+59% YTD).
- Meanwhile, the factor-based value ETF (VLUE) has a 25% weight in Micron and another 4.6% in Intel.
Maybe value is still “value,” but to be clear it’s also become an AI play. Or rather, your traditional “growth” baskets are not the only place to find AI-related exposure, which also means the traditional “value” baskets are not quite as diversifying to AI-related stocks as one may think.
Prepare for Rotation, but Rotation Could Mean the End Is Here
Another way to think about diversifying away from AI is to look at areas of the market that are not correlated with AI. For a couple of years now we have discussed barbelling some of our momentum exposure with low volatility. Yes, that has done worse than just solely betting on momentum, but the more momentum keeps rising, the more comfortable we are with low volatility. If everything in your portfolio is outperforming, that probably means you are not diversified enough.
Another approach is to look at sectors, but you have to be careful here as several sectors have closer ties to AI than you would think. We looked at the correlation of constituent names within all 11 sectors with the technology sector since March 31 (when technology stocks surged) and added up the total weight of individual names within each sector that had a significant correlation to tech (over 0.3).
Beyond the obvious suspects like consumer discretionary and communication services, sectors like industrials and materials also have a significant proportion of companies that have a relatively high correlation with technology. For example: for industrials, over 40% of the sector has a 0.3 correlation with technology and over 30% have a 0.4 correlation. On the other hand, sectors like healthcare and consumer staples have barely any weight with a significant correlation with technology.
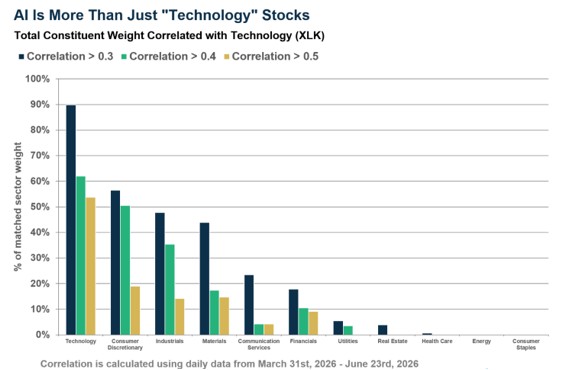
Source: FactSet, YCharts
At the same time, if we do see sustained rotation from AI-related companies (and sectors) to other parts of the market, say for over 6-12 months, that probably means the AI trade is over. The bubble has likely been pricked. This is essentially what happened in 2000, after the dot-com bubble bust.
I looked at returns from the end of 1997 through March 2003 (the bottom) for all the sectors, as well as the momentum and low volatility factors (long only). I separated this into three periods:
- January 1998 – March 2003 (the bubble)
- April 2003 – December 2000 (rotation)
- January 2001 – March 2003 (the crash)
Some highlights:
- No surprise, technology and momentum saw huge returns during the bubble and then collapsed after that. Tech-adjacent sectors like communication services (which includes telecom) and consumer discretionary also gained a lot.
- Sectors outside of the top 3 tech-adjacent sectors had reasonably solid returns during the “bubble,” so there was breadth. Staples was the only sector with a negative return. The low volatility factor was also negative.
- April 2000 through December 2000 saw a lot of rotation, with the 3 tech-adjacent sectors and momentum collapsing, while most other sectors and low volatility gained.
- The crash (January 2001 – March 2003) saw every sector hit quite hard, with tech and momentum taking the hardest blow.
- Over the full period, what is interesting is that health care, energy, financials, and even consumer discretionary had positive returns. Momentum was also positive despite steep drawdowns, though low volatility outperformed over the 5+ years as did a simple average of health care, financials, and energy sectors.
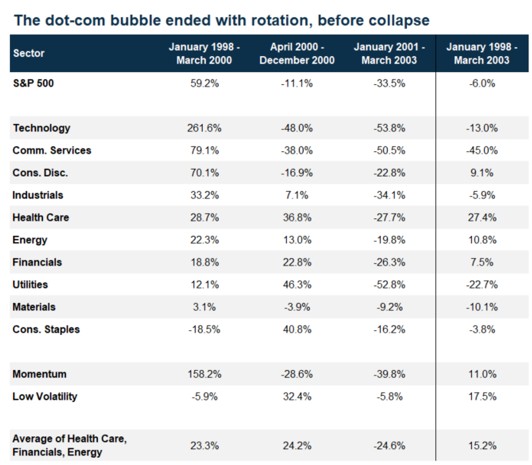
Source: FactSet, Bloomberg
Final Thoughts
As I noted at the top, I have no idea what stage of the bubble we are in, nor when it will pop. But instead of worrying about it, I feel increasingly comfortable judiciously diversifying outside of AI, despite the opportunity cost of missing out on large gains by overweighting. In a way, it is an admission that we cannot perfectly (or even near perfectly) time the top, and “get out in time, before everyone else.” Good luck with that. Instead, the more we see momentum run, the more diversified we will try to get, which is our way of riding the wave, but trying to avoid a wipeout on the other side of it all.
It is our aim at Asbury Wealth Partners that you find the market commentary we provide informative and useful. As our success grows mainly through referrals from our clients, we encourage you to share this weekly newsletter with your friends, family, and colleagues. If you are a client, we thank you for your business and your confidence. If you are not yet a client, we encourage you to contact us today and explore how our team may be able to add value to your unique financial situation.
Thanks as always for reading, and I hope everyone is having a great start to summer!
Thank You,
Jeff
~~~~~~~~~~~~~~~~~~~~~~~
Jeffrey S. Markewich
Wealth Advisor
Off – 719-548-8103
Cell - 719-357-7747
Text – 702-493-9678
TF - 888-328-7655
~~~~~~~~~~~~~~~~~~~~~~~
An Introduction to Your Friends & Family
is the Greatest Compliment You Can Give
Jeffrey Markewich is a Registered Representative with, and securities and advisory services offered through LPL Financial, a registered investment advisor, Member FINRA/SIPC.
The information contained in this email message is being transmitted to and is intended for the use of only the individual(s) to whom it is addressed. If the reader
of this message is not the intended recipient, you are hereby advised that any dissemination, distribution or copying of this message is strictly prohibited. If you have received this message in error, please reply and you will be removed.
These views are those of the author, not of the broker-dealer or its affiliates. This material contains an assessment of the market and economic environment at a specific point in time and is not intended to be a forecast of future events, or a guarantee of future results. All investments involve risk, including loss of principal. Forward-looking statements are subject to certain risks and uncertainties. Actual results, performance, or achievements may differ materially from those expressed or implied. Information is based on data gathered from what we believe are reliable sources.
The opinions voiced in this material are for general information only and are not intended to provide specific advice or recommendations for any individual. All performance referenced is historical and is no guarantee of future results. All indices are unmanaged and may not be invested into directly.
The NASDAQ Composite Index measures all NASDAQ domestic and non-U.S. based common stocks listed on The NASDAQ Stock Market. The market value, the last sale price multiplied by total shares outstanding, is calculated throughout the trading day, and is related to the total value of the Index.
S&P 500 – A capitalization-weighted index of 500 stocks designed to measure performance of the broad domestic economy through changes in the aggregate market value of 500 stocks representing all major industries.
The Dow Jones Industrial Average is comprised of 30 stocks that are major factors in their industries and widely held by individuals and institutional investors.
The Russell 2000 Index is an unmanaged index generally representative of the 2,000 smallest companies in the Russell 3000 index, which represents approximately 10% of the total market capitalization of the Russell 3000 Index.
The CBOE Volatility Index? (VIX?) is meant to be forward looking, showing the market's expectation of 30-day volatility in either direction, and is considered by many to be a barometer of investor sentiment and market volatility, commonly referred to as “Investor Fear Gauge”.
International investing involves special risks such as currency fluctuation and political instability and may not be suitable for all investors.
All indexes referenced are unmanaged. The volatility of indexes could be materially different from that of a client’s portfolio. Unmanaged index returns do not reflect fees, expenses, or sales charges. You cannot invest directly in an index. Consult your financial professional before making any investment decision.
There is no guarantee that a diversified portfolio will enhance overall returns or outperform a non-diversified portfolio. Diversification does not protect against market risk.
Asset allocation does not ensure a profit or protect against a loss.
The Consumer Price Indexes (CPI) program produces monthly data on changes in the prices paid by urban consumers for a representative basket of goods and services (Source: U.S. Department of Labor).
The Gross Domestic Product (GDP) is a comprehensive measure of U.S. economic activity. GDP measures the value of the final goods and services produced in the United States (without double counting the intermediate goods and services used up to produce them). Changes in GDP are the most popular indicator of the nation's overall economic health.
Government bonds and Treasury bills are guaranteed by the US government as to the timely payment of principal and interest and, if held to maturity, offer a fixed rate of return and fixed principal value.
LPL Tracking #1131945