


Market Insights 5/4/26
Observations & Insights – May 4, 2026
Stocks Gain Modestly
U.S. indexes rose modestly for the second week in a row, in contrast with the rapid advances that stocks generated in the first three weeks of April. The S&P 500 and NASDAQ both added around 1% for the week, pushing their record levels higher. The Dow edged up 0.5%, finishing -1.4% below its record set nearly three months ago.
Key Points
- U.S. equities surged in April, with the Nasdaq Composite and the S&P 500 rising seeing their strongest monthly gains since 2020.
- The Federal Reserve held rates steady but showed internal division, while Jerome Powell nears the end of his term and Kevin Warsh moves closer to confirmation.
- The U.S. economy grew at a 2% annual rate in Q1, signaling modest improvement but still falling short of expectations and prior stronger growth levels.
- Inflation remains elevated with core PCE at 3.2% and oil volatility continuing to create uncertainty alongside an uneven labor market.
- Stock gains this year are not a mystery despite the uncertainty, gains been driven by earnings growth, primarily from strong margin growth.
Observations: Bullish April, Fed Transition in Focus
U.S. stocks rebounded in a big way from their negative first-quarter results, with two indexes posting double-digit returns in April. The NASDAQ rose 15.3% to record its biggest monthly gain since April 2020, while the S&P 500’s 10.4% rise was that index’s biggest since November 2020. The Dow advanced 7.1% for its strongest monthly result since November 2024.
Although the U.S. Federal Reserve kept its benchmark rate unchanged, its updated policy statement drew dissents from 4 of 12 members, reflecting wide-ranging views on the path forward. It was likely the final meeting led by Jerome Powell, who said he plans to remain a Fed governor after his term as chair ends this month. Kevin Warsh’s nomination to replace Powell cleared a Senate panel, setting up a confirmation vote by the full Senate.
Earnings season forecasts rose sharply after a handful of mega-cap tech companies reported better-than-expected results. As of Friday, analysts projected that earnings for S&P 500 companies rose 27.1% in the first quarter, up from a 15.0% forecast at the end of the previous week, according to FactSet. The latest forecast was based on the 63% of S&P 500 companies that had reported results as of Friday, plus projections for those that have not yet released their numbers.
U.S. GDP grew at a 2% annual rate in this year’s first quarter as the economy gained momentum after posting a 0.5% result in the preceding quarter. Despite the acceleration, the government’s initial first-quarter estimate came in slightly lower than most economists had forecast, and it marked a slowdown from the 4.4% rate recorded in last year’s third quarter.
The U.S. Federal Reserve’s preferred gauge for tracking inflation showed a sharp monthly increase as higher oil prices rippled across the broader economy. Excluding volatile energy and food costs, the core Personal Consumer Expenditures Price Index climbed to an annual rate of 3.2% in March. The reading matched most economists’ estimates and marked the highest level since November 2023.
Oil again traded in a wide range, briefly hitting the highest level since early April before pulling back late in the week. U.S. crude was trading around $102 per barrel on Friday afternoon after ending the previous week around $95. On Thursday, oil traded as high as $110; a couple of weeks earlier, it was around $84.
A jobs report due out on Friday will show whether recent strengthening in the labor market extended into April. In March, the economy added an above-forecast 178,000 jobs, rebounding from a net loss of 133,000 in February. The labor market has been stuck in a zig-zag pattern over the past 10 months, posting job declines over five of those months, followed by gains in each of the subsequent months.
Insights: Markets Are Enthusiastic for the Right Reasons
Another week and continued optimism despite the ebbs & flows of progress in the Middle East and strong earnings gains have kept the stock market rally rolling. The S&P 500 gained 10.4% in April, which was the second-best April ever (only 2020 was better).
Source: FactSet
Optimism, or at least normalization, over the Middle East situation is helping, but at the end of the day, stronger earnings are likely a bigger reason for the gains. 28% of the S&P 500 has now reported, and 84% of companies have beaten Q1 earnings estimates while 81% have beaten revenue estimates. We are aware there is confusion over how stocks could be back to new highs so soon, but in the end, strong earnings drive longer-term stock gains, and continued earnings strength is a big reason behind the rebound.
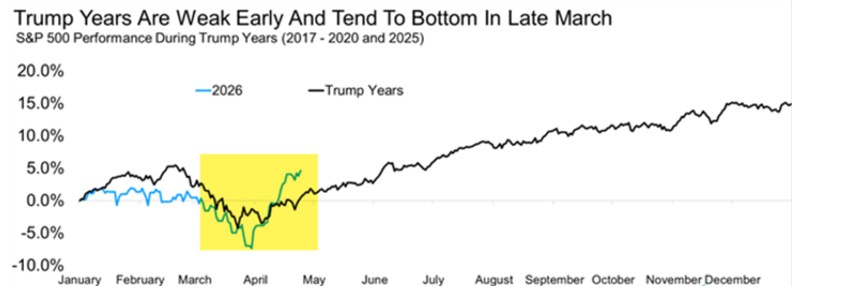
March Weakness Is Normal in Recent Years
Mark Twain famously quipped, “History doesn’t repeat, but it often rhymes.” Well, we could be looking at history rhyming once again with another March low. In fact, under President Trump, it has been perfectly normal for the S&P 500 to start the new year off well, tank in March, and then rally over the rest of the year. So far, that sounds like this year, with stocks up early in 2026, then falling -5.1% in March. Yes, 2020 and COVID are major contributors to the pattern (down -12.5% in March), but last year saw a weak month of March as well (down -5.8%) due to worries over tariffs and AI. The bottom line, looking at the five years under President Trump, is that market lows right around now have become normal. The other bit of good news for investors is that the rest of the year can be pretty good, something we expect again this year.
Source: FactSet
Semiconductor Stocks Are on Fire
The US is very tech-heavy, and there is no more important group to tech overall than semiconductors. Incredibly, the iShares Semiconductor ETF (SOXX) is up a record-breaking 18 days in a row. As we noted last week, some of the huge record-breaking moves we have seen the past few weeks have historically been a bullish signal long-term. Well, to see this influential group taking back the baton and leading stocks to new highs is yet another positive for the bulls.
Source: StockCharts
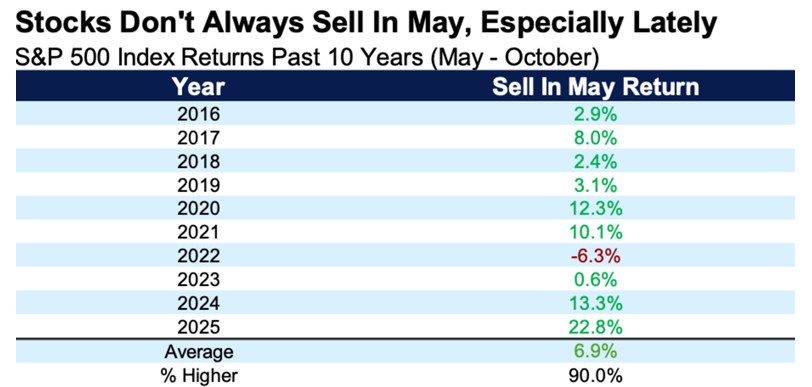
‘Sell in May’ Is Nearly Here
Prepare to hear a lot about this. The worst six months of the year for the S&P 500 historically are May through October. This stretch gave us the well-known saying “Sell in May and go away,” so we like to call May to October the “Sell in May” period. Here is the thing, it has not worked at all lately. In fact, last year at this time, many were worried about tariffs and the fallout that would come with them, yet we saw the largest May-to-October gain ever (up nearly 23%). So, how have those six months done lately? Higher nine of the past 10 years and up nearly 7% on average. We continue to think we could see a strong move higher into year end, and we would suggest not selling in May this time around.
Source: FactSet
There’s No Puzzle as to Why Stocks Are at All-Time Highs
The S&P 500 and Nasdaq hit new all-time highs last week, and this is not sitting well with many people. We are seeing a steady stream of commentary along the lines of “this does not make sense” and “risk assets are detached from reality.” Or that markets are looking past the Middle East crisis. But we do not think markets are ignoring anything. They are focused on what matters: profits.
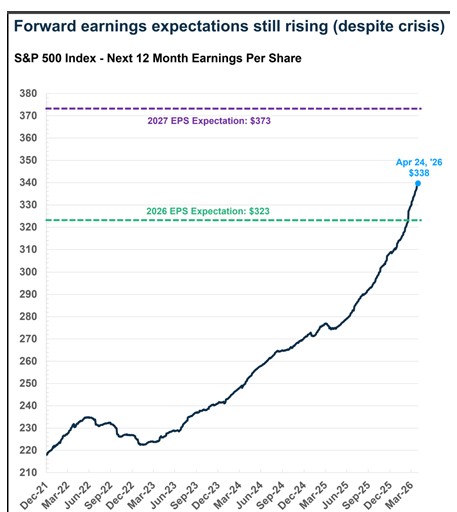
The S&P 500 is now up 5.1% year-to-date (as of April 24), including dividends. That is entirely rising profit growth estimates. The S&P 500’s next 12-month earnings per share (EPS) is currently $338/share, up almost 10% since the end of last year and 6.5% over the past eight weeks (since the crisis began). In other words, almost two-thirds of the gain in EPS has come while the war of Iran was raging on.
Keep in mind that the EPS is now mostly about 2026 EPS expectations. Almost two-thirds of EPS is expected EPS for 2026 ($323) and one-third expected EPS for 2027 ($373). At the end of the year, the estimate will match the 2027 estimate exactly. As the year moves forward, EPS should continue rising, since it will be weighted more toward 2027 and less toward 2026 (that is, as long as 2027 EPS does not fall significantly). In other words, we are looking at yet another year of strong EPS growth. Right now, the expectation is that 2027 EPS will be 16% higher than 2026 EPS.
Source: FactSet
With growth in earnings in mind, let’s look at what’s contributed to the S&P 500’s return this year. We can separate the return into three basic pieces.
- Earnings growth
- Multiple change (change in the price-to-earnings ratio, a proxy for what investors are willing to pay for earnings)
- Dividends
For the S&P 500, the year-to-date return of 5.1% came from:
- Earnings growth contribution: +9.4 percentage points
- Multiple growth contribution: -4.8 percentage points
- Dividends: +0.4 percentage points
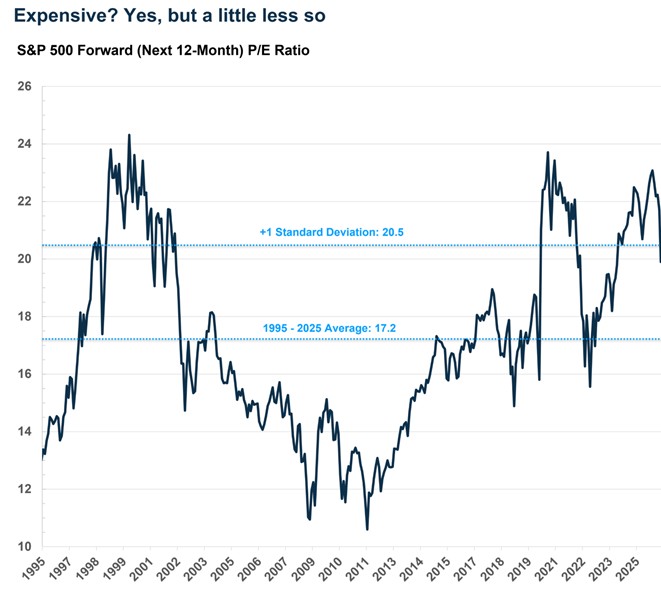
In short, the year-to-date return is almost entirely on the back of rising profit expectations, which has more than offset multiple contractions. The forward P/E is now at 21.3x, down from 22.2x at the end of 2025. At the pre-crisis all-time high (January 27), the forward P/E was 22.5x, and back in October of last year, the forward P/E had gotten as high as 23.5x. At the lowest point of the recent pullback (March 30), the forward P/E had fallen as low as 19.3x.
All this to say, the index is at new record highs, but multiples are lower now than they were a few months ago. Usually, as earnings expectations rise, you tend to see more optimism and the P/E ratio rises. But that has not happened recently, and the big reason is that real rates have jumped as investors priced in a less dovish Fed amid higher inflation.
Source: S&P
A Closer Look at Profit Growth
Profit growth itself can be separated into two pieces: sales growth and margin expansion. Sales growth is closely tied to nominal GDP growth, and as long as we do not have a recession, sales growth should run fairly strong. This was the case even in 2022, when sales growth was a healthy 8.5% as nominal GDP growth clocked in around 8% that year. But EPS growth was weak in 2022 (+3.8%) because of a pullback in margins amid surging interest rates.
However, margins have expanded a lot over the last three years. Forward margins were around 12% at the end of 2019 and had expanded to 12.7% by the end of 2022. The growth has continued, and margins sat at 14.5% by the end of 2025, a new all-time high. And they have expanded even further to 15.2% this year.
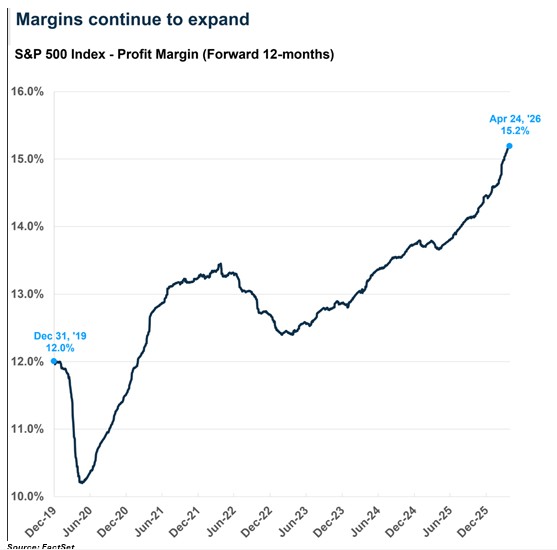
Source: FactSet
Here is a look at how this has actually helped S&P 500 returns year-to-date. We do the same breakdown as above but also break down earnings growth into sales and margins. As we noted above, the S&P 500 is up 5.1% year to date. Here are the contributions:
- Earnings growth: +9.4 percentage points
- Sales growth: +4.4 percentage points
- Margin expansion: +5.0 percentage points
- Multiple growth: -4.8 percentage points
- Dividends: +0.4 percentage points
In short, expected profit margin expansion is the biggest driver of profit growth so far in 2026 (this is all forward looking), even more so than sales growth expectations.
Source: FactSet
This is all captured in the above chart, which explains why the index is at all-time highs despite a major crisis in the Middle East.
- The primary driver of the year-to-date return is margin expansion, but the other side of this is inflation.
- Sales growth is strong on the back of strong nominal GDP growth (5% to 6%) but that’s because of inflation rather than real GDP growth (which is likely to run ~2%, below trend for a second straight year).
- Multiple contraction has been a drag on returns, as markets price in fewer rate cuts and a relatively less dovish Fed amid higher inflation.
The Profit Margin Expansion Story Is Also an Inflation Story
Too many commentators are making the mistake of translating an inflation surge into weaker real consumption, and hence weaker economic growth and profit growth. But rising inflation also means margins are rising, and that is driving profit expectations higher. This becomes clearer when we look at individual sectors.
The S&P 500’s 2026 EPS expectation has risen over 4.5% since the start of the year, from $309 to $323. The 2027 EPS expectation has jumped even more, rising over 5% from $355 to $373.
A breakdown of the 11 S&P 500 sectors shows exactly which sectors are boosting the aggregate index’s profit (EPS) expectations. Most of the growth is focused in three sectors: technology, energy, and materials. From the start of the year through April 24:
- The tech sector has seen 2026 EPS expectations grow over 11% and 2027 EPS grow over 15%.
- Energy has seen 2026 EPS expectations grow by almost 40% and 2027 EPS by 14%.
- Materials has seen 2026 EPS expectations grow over 11% and 2027 EPS by almost 10%.
The remaining sectors have not seen EPS estimates pull back in a significant way, but we have seen some downward adjustments for sectors that are hit harder by higher input prices, like consumer discretionary, industrials, healthcare, and consumer staples.
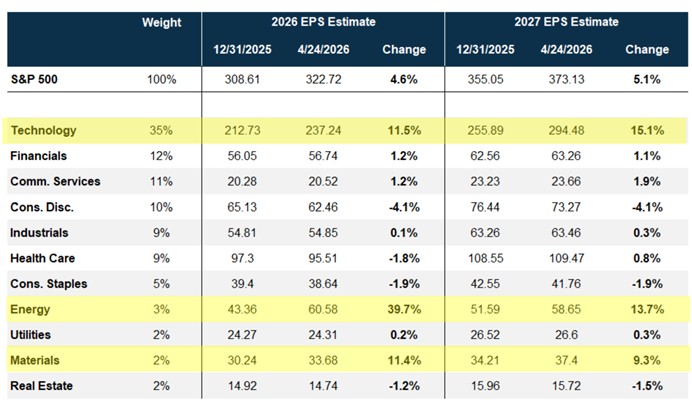
Source: FactSet
Highlighting inflation is not to say it is all “predatory price gouging.” A lot of these firms are in the right place at the right time, whether it’s chip manufacturers (in the US or even in South Korea and Taiwan) or energy companies.
As John Maynard Keynes said:
“Profiteers are a consequence, not a cause, of rising prices.”
In any case, the ultimate beneficiary has been stock prices (and investors). That is likely to hold up as long as the Fed continues to view inflation once again as “transitory.” For now, we continue to have a dovish tailwind in the form of a Fed that is likely to look the other way on inflation. For a moment there, markets had taken out the possibility of any rate cuts this year amid renewed inflation concerns, but over the last two weeks, markets once again priced in a higher probability of at least one cut (about 25% to 30%).
As we have highlighted in recent weeks and months, inflation remains elevated even outside of energy, and the Fed had a problem even prior to the Middle East crisis. In fact, the Fed holding rates steady would imply policy is getting looser as inflation picks up, setting aside any rate cuts in this environment. That would be a tailwind for stocks, at least until the Fed gets serious about inflation and lands in a situation where they are forced to hike rates to such a degree that it not only curbs inflation, but also pushes the economy into recession in the process. Surging policy rates would raise real rates and hit multiples hard, pulling the index lower.
For now, that’s not in the cards, hence the focus on potential upsides. At the same time, an inflationary regime means we must balance contrasting ideas in our head, like the prospect of rising corporate profits even as inflation remains elevated. The inflation picture confounds normal analysis of what the economy and companies are likely to do, and here it’s important to even differentiate between real and nominal GDP growth. It’s the latter that matters for revenues and profits.
Final Thoughts
We continue to believe the most important message from the market right now is this: the rally is being driven by the right reasons. Strong earnings, improving margins, and broader participation are not characteristics of a fragile market—they are characteristics of a market with underlying strength. That does not mean we will not see volatility, we will. It does not mean risks have disappeared, they have not. But it does suggest that the foundation beneath this market is more solid than many believe. And as we often remind clients: markets do not need perfect conditions to move higher, just better ones than what investors are already expecting.
It is our aim at Asbury Wealth Partners that you find the market commentary we provide informative and useful. As our success grows mainly through referrals from our clients, we encourage you to share this weekly newsletter with your friends, family, and colleagues. If you are a client, we thank you for your business and your confidence. If you are not yet a client, we encourage you to contact us today and explore how our team may be able to add value to your unique financial situation.
Thank You,
Jeff
~~~~~~~~~~~~~~~~~~~~~~~
Jeffrey S. Markewich
Wealth Advisor
Off – 719-548-8103
Cell - 719-357-7747
Text – 702-493-9678
TF - 888-328-7655
~~~~~~~~~~~~~~~~~~~~~~~
An Introduction to Your Friends & Family
is the Greatest Compliment You Can Give
Jeffrey Markewich is a Registered Representative with, and securities and advisory services offered through LPL Financial, a registered investment advisor, Member FINRA/SIPC.
The information contained in this email message is being transmitted to and is intended for the use of only the individual(s) to whom it is addressed. If the reader
of this message is not the intended recipient, you are hereby advised that any dissemination, distribution or copying of this message is strictly prohibited. If you have received this message in error, please reply and you will be removed.
These views are those of the author, not of the broker-dealer or its affiliates. This material contains an assessment of the market and economic environment at a specific point in time and is not intended to be a forecast of future events, or a guarantee of future results. All investments involve risk, including loss of principal. Forward-looking statements are subject to certain risks and uncertainties. Actual results, performance, or achievements may differ materially from those expressed or implied. Information is based on data gathered from what we believe are reliable sources.
The NASDAQ Composite Index measures all NASDAQ domestic and non-U.S. based common stocks listed on The NASDAQ Stock Market. The market value, the last sale price multiplied by total shares outstanding, is calculated throughout the trading day, and is related to the total value of the Index.
S&P 500 – A capitalization-weighted index of 500 stocks designed to measure performance of the broad domestic economy through changes in the aggregate market value of 500 stocks representing all major industries.
The Dow Jones Industrial Average is comprised of 30 stocks that are major factors in their industries and widely held by individuals and institutional investors.
The Russell 2000 Index is an unmanaged index generally representative of the 2,000 smallest companies in the Russell 3000 index, which represents approximately 10% of the total market capitalization of the Russell 3000 Index.
The CBOE Volatility Index? (VIX?) is meant to be forward looking, showing the market's expectation of 30-day volatility in either direction, and is considered by many to be a barometer of investor sentiment and market volatility, commonly referred to as “Investor Fear Gauge”.
International investing involves special risks such as currency fluctuation and political instability and may not be suitable for all investors.
All indexes referenced are unmanaged. The volatility of indexes could be materially different from that of a client’s portfolio. Unmanaged index returns do not reflect fees, expenses, or sales charges. You cannot invest directly in an index. Consult your financial professional before making any investment decision.
There is no guarantee that a diversified portfolio will enhance overall returns or outperform a non-diversified portfolio. Diversification does not protect against market risk.