


Market Insights 4/13/26
Observations & Insights – April 13, 2026
Cars & Coffee this Saturday,
10am to Noon in our parking lot… weather permitting! (attached)
Rally Continues!
The major U.S. stock indexes surged 3% to 5%, roughly matching the magnitude of the previous week’s gains. An easing of tensions in the Middle East sent oil prices down about 13%, providing lift for stocks.
Key Points
- Markets rally to be approximately flat for the year on talk of ceasefire deal with Iran.
- Oil retreats but remains substantially higher from before the Iran war.
- Inflation remains closer to 3% than the Fed target of 2%, putting them in a tough spot.
- Interest rates may need to stay higher for longer.
Observations: Stocks Rise as Oil Prices Retreat
The market’s back-to-back weekly gains went a long way toward reversing March’s declines. The NASDAQ’s cumulative gain for the two weeks was about 9%, the S&P 500’s was 7%, and the Dow’s was 6%. Year to date through Friday, the S&P 500 and the Dow were essentially flat on a total return basis while the NASDAQ was down just about -1%.
Rising energy costs lifted the latest Consumer Price Index reading to an annual rate of 3.3%, well above the U.S. Federal Reserve’s long-term target of around 2.0%. March’s figure, released on Friday, was up sharply from the previous month’s 2.4% reading. The energy price component of CPI surged 12.5% year over year as higher oil prices translate into the inflation numbers.
An easing of Middle East tensions sent oil prices sharply lower, with U.S. crude dropping about -15% on Wednesday to as low as $91 per barrel following a cease-fire announcement. On Friday afternoon, oil was trading around $96, down about -13% for the week and well below a recent peak of around $119 reached in intraday trading on March 9.
The U.S. economy expanded at a far slower pace in late 2025 than earlier estimates had indicated. Friday’s latest revision showed that GDP grew at an annual rate of 0.5% in the fourth quarter, down from a 0.7% estimate released in mid-March and an initial February reading of 1.4%. In contrast, the annual growth rate in the third quarter was 4.4%, the highest in two years.
A monthly gauge of U.S. consumer sentiment fell sharply, extending a recent decline amid conflict in the Middle East and the resulting spike in energy prices. The University of Michigan’s survey results released on Friday showed that sentiment fell to a preliminary April reading of 47.6, down from 53.3 in March and 56.6 in February.
Gold prices climbed for the second week in a row, regaining more of the ground lost in a mid-March sell-off. On Friday afternoon, gold was trading around $4,800 per ounce, up more than 2% for the week on the heels of a similar rise the previous week. Nevertheless, the precious metal remained well below the record high of around $5,500 set in late January.
Wall Street analysts modestly scaled back their expectations as major U.S. banks prepared to open quarterly earnings season. As of Friday, analysts surveyed by FactSet were forecasting an average first-quarter earnings growth rate of around 12.6% for companies in the S&P 500, down from a 13.2% forecast a week earlier. Either outcome would mark the sixth consecutive quarter of double-digit earnings growth.
Insights: Relief Rally vs. Reality Check
The Market Celebrates, But Not Everyone Is Buying It
“History doesn’t repeat itself, but it often rhymes.” — Mark Twain
Markets did what markets tend to do best—they reacted quickly and decisively to good news. Headlines surrounding a ceasefire sparked a powerful relief rally, with equities moving higher across the board. What was particularly encouraging was not just the magnitude of the move, but the breadth beneath the surface. Small caps participated, international markets joined in, and leadership broadened beyond the usual handful of mega-cap names.
On the surface, this is exactly what you want to see in a healthy bull market. Strong breadth, improving participation, and a willingness by investors to lean into risk are all constructive signals. These are the types of developments that typically occur when markets are looking forward—not backward.
But here is where things get interesting and where we need to separate signal from noise.
While equities were celebrating, the bond market remained notably unimpressed. Treasury yields barely moved in response to the same headlines that sent stocks sharply higher. In fact, when you zoom out even slightly, yields remain meaningfully higher than where they were before the geopolitical tensions escalated.
That’s not a small detail.
Bond markets are often less emotional and more grounded in macro fundamentals—particularly inflation and monetary policy expectations. And right now, they are sending a very different message than equities. The lack of a meaningful drop in yields suggests that investors in fixed income are not convinced that inflation risks have materially improved.
In other words, while stocks are pricing in relief, bonds are pricing in persistence.
The same dynamic is showing up in energy markets. Oil initially sold off on the ceasefire news, which makes sense—reduced geopolitical risk typically translates into lower supply disruption concerns. But the key detail is what happened next. Prices stabilized quickly and began to move higher again, with longer-dated futures still reflecting elevated levels relative to where they were before the conflict.
That tells us something important:
The market may be pricing out the worst-case scenario, but it is not pricing a return to normal.
And that distinction matters.
Because if energy prices remain elevated—even at a lower level than peak panic—it continues to feed into inflation expectations. Transportation costs, input costs, and ultimately consumer prices all remain under pressure. That’s exactly the type of environment where inflation doesn’t spike dramatically—but also doesn’t come down easily.
So we’re left with a market sending mixed signals:
- Equities: Growth is intact, risks are fading, and the path forward looks clearer
- Bonds & Oil: Inflation risks remain, and policy may need to stay tighter for longer
When you see that kind of divergence, it’s usually worth paying attention—not dismissing it.
The Inflation Problem Is Not Gone, It’s Just Changed
There has been a growing narrative over the past several months that inflation has largely been solved. The logic is straightforward: inflation peaked, the Fed tightened aggressively, and now we are trending back toward normal.
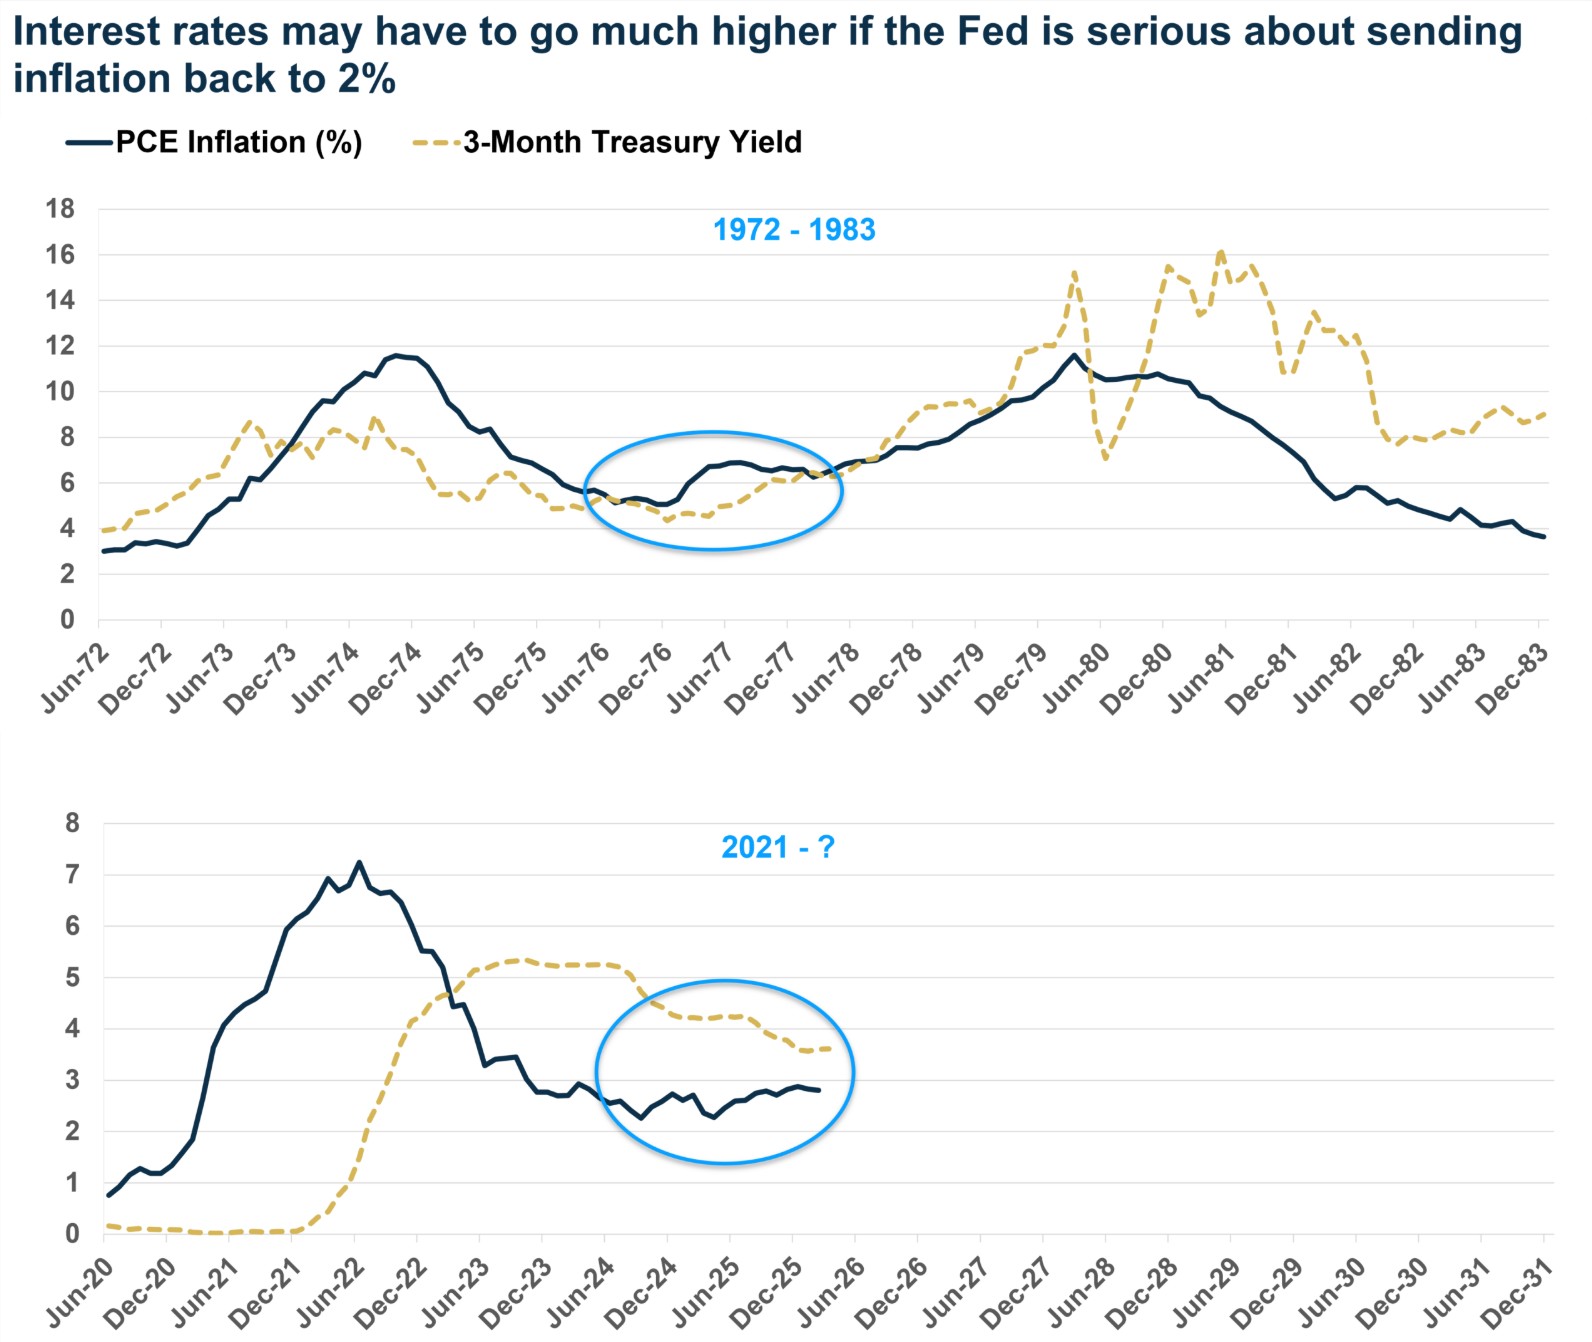
But the data, and more importantly, the structure of the current environment, suggests something quite different. Inflation has not disappeared. It has settled into a higher range.
Source: FRED
Since 2021, inflation has averaged meaningfully above the Federal Reserve’s 2% target. Even after aggressive rate hikes, we are still running closer to 3% than 2%. That may not sound like a big difference, but over time, it compounds in a way that materially impacts both consumers and markets.
More importantly, the composition of inflation has shifted. Goods inflation has cooled, as expected, but services inflation remains sticky. Labor markets are still relatively strong, wage pressures are still present, and areas like healthcare, insurance, and financial services continue to push higher. These are not categories that reverse quickly, they tend to persist. Now layer on top of that what we are currently seeing:
- Energy prices remain volatile and elevated.
- Geopolitical tensions are impacting supply chains and commodities.
- Tariffs and policy shifts are beginning to reintroduce pricing pressures.
- The Fed has already begun to ease policy expectations, despite inflation still running above target.
If that combination sounds familiar, it should.
It closely resembles the setup we saw in the 1970s, where inflation came down from peak levels, policymakers believed progress had been made, and policy began to ease, only to see inflation re-accelerate in a second wave as a direct result of the energy crunch.
Now, to be clear, this is not a prediction that we are heading into a repeat of that decade. The structure of today’s economy is different in many ways. But the pattern is similar enough that it deserves attention.
The real issue is not whether inflation spikes dramatically from here. The bigger risk is that it remains persistently above target, forcing the Federal Reserve into a difficult position. The Fed has two levers; they can keep policy tight and risk slowing growth more than intended OR they can ease policy and risk reigniting inflationary pressures.
Neither outcome is ideal.
And this is where the bond market’s message becomes even more relevant. If inflation settles into a structurally higher range, say closer to 3% than 2%, then interest rates may also need to settle at a higher level than what markets became accustomed to over the past decade. This has implications across the board that we are already seeing:
- Equity valuations may face pressure at the margin.
- Bonds may not provide the same diversification benefits during equity volatility.
- Market leadership may continue to broaden beyond a narrow group of growth stocks.
- Active positioning and diversification become more important than ever.
Source: Carson Research
Final Thoughts
The current environment is not one of extremes, it is one of tension between two realities. On one hand, the economy remains resilient, earnings are holding up, and markets are finding reasons to move higher. On the other hand, inflation is proving more stubborn than expected, and the policy path forward is far from clear. That tension is exactly what we are seeing reflected in the divergence between stocks and bonds.
And if history does rhyme, the next phase of this market will likely be defined not by whether growth holds up, but by how persistent inflation ultimately proves to be. For now, we remain constructive, but increasingly aware that the path forward may be less straightforward than the recent rally would suggest.
It is our aim at Asbury Wealth Partners that you find the market commentary we provide informative and useful. As our success grows mainly through referrals from our clients, we encourage you to share this weekly newsletter with your friends, family, and colleagues. If you are a client, we thank you for your business and your confidence. If you are not yet a client, we encourage you to contact us today and explore how our team may be able to add value to your unique financial situation.
Thank You,
Jeff
~~~~~~~~~~~~~~~~~~~~~~~
Jeffrey S. Markewich
Wealth Advisor
Off – 719-548-8103
Cell - 719-357-7747
Text – 702-493-9678
TF - 888-328-7655
~~~~~~~~~~~~~~~~~~~~~~~
An Introduction to Your Friends & Family
is the Greatest Compliment You Can Give
Jeffrey Markewich is a Registered Representative with, and securities and advisory services offered through LPL Financial, a registered investment advisor, Member FINRA/SIPC.
The information contained in this email message is being transmitted to and is intended for the use of only the individual(s) to whom it is addressed. If the reader
of this message is not the intended recipient, you are hereby advised that any dissemination, distribution or copying of this message is strictly prohibited. If you have received this message in error, please reply and you will be removed.
These views are those of the author, not of the broker-dealer or its affiliates. This material contains an assessment of the market and economic environment at a specific point in time and is not intended to be a forecast of future events, or a guarantee of future results. All investments involve risk, including loss of principal. Forward-looking statements are subject to certain risks and uncertainties. Actual results, performance, or achievements may differ materially from those expressed or implied. Information is based on data gathered from what we believe are reliable sources.
The NASDAQ Composite Index measures all NASDAQ domestic and non-U.S. based common stocks listed on The NASDAQ Stock Market. The market value, the last sale price multiplied by total shares outstanding, is calculated throughout the trading day, and is related to the total value of the Index.
S&P 500 – A capitalization-weighted index of 500 stocks designed to measure performance of the broad domestic economy through changes in the aggregate market value of 500 stocks representing all major industries.
The Dow Jones Industrial Average is comprised of 30 stocks that are major factors in their industries and widely held by individuals and institutional investors.
The Russell 2000 Index is an unmanaged index generally representative of the 2,000 smallest companies in the Russell 3000 index, which represents approximately 10% of the total market capitalization of the Russell 3000 Index.
The CBOE Volatility Index? (VIX?) is meant to be forward looking, showing the market's expectation of 30-day volatility in either direction, and is considered by many to be a barometer of investor sentiment and market volatility, commonly referred to as “Investor Fear Gauge”.
International investing involves special risks such as currency fluctuation and political instability and may not be suitable for all investors.
All indexes referenced are unmanaged. The volatility of indexes could be materially different from that of a client’s portfolio. Unmanaged index returns do not reflect fees, expenses, or sales charges. You cannot invest directly in an index. Consult your financial professional before making any investment decision.
There is no guarantee that a diversified portfolio will enhance overall returns or outperform a non-diversified portfolio. Diversification does not protect against market risk.
Asset allocation does not ensure a profit or protect against a loss.
The Consumer Price Indexes (CPI) program produces monthly data on changes in the prices paid by urban consumers for a representative basket of goods and services (Source: U.S. Department of Labor).
The Gross Domestic Product (GDP) is a comprehensive measure of U.S. economic activity. GDP measures the value of the final goods and services produced in the United States (without double counting the intermediate goods and services used up to produce them). Changes in GDP are the most popular indicator of the nation's overall economic health.
Government bonds and Treasury bills are guaranteed by the US government as to the timely payment of principal and interest and, if held to maturity, offer a fixed rate of return and fixed principal value.
LPL Tracking #1092136