


Market Insights 2/24/26
Observations & Insights – February 24, 2026
Market Rebound
The major U.S. stock indexes recovered most of the ground they lost the previous week, extending the market’s meandering, range-bound start to 2026. The NASDAQ finished 1.5% higher, snapping a string of five consecutive weekly declines, while the S&P 500 gained 1.1% and the Dow added 0.3%.
Key Points
- The Supreme Court ruled the administration exceeded its authority in imposing broad tariffs.
- Fourth-quarter GDP grew at 1.4%, below expectations and sharply lower than Q3’s 4.4%.
- January job growth of 130,000 more than doubled expectations of 55,000; the unemployment rate fell to 4.3%.
- Headline PCE inflation jumped to 2.9% year-over-year, while CPI recently showed 2.4%.
- Crude oil climbed nearly 6% on geopolitical tensions.
- Bitcoin stabilized but remains down sharply year-to-date.
- The S&P 500 continues trading in a range between roughly 6,750 and 7,150.
Observations: Supreme Court Rules Against Tariffs
Despite last week’s equity market rebound, the broader tone remains one of consolidation rather than acceleration. Leadership continues to rotate beneath the surface, volatility remains elevated relative to last year, and investors are weighing slower economic growth against the possibility of policy support later in 2026.
The big news of last week was that in a 6-3 decision, the U.S. Supreme Court on Friday ruled that the Trump administration exceeded its legal authority last year when it imposed tariffs on imported goods from most of the nation’s biggest trading partners. The ruling did not appear to resolve whether the government must repay tariff revenue that it has already collected.
The U.S. economy expanded at a slower pace than expected at the end of 2025. GDP grew at an annualized rate of 1.4% in the fourth quarter, below economists’ consensus estimate of roughly 2.5% growth and far behind the third quarter’s 4.4% rate. One negative factor was a decline in federal spending amid the fourth quarter’s prolonged government shutdown.
The U.S. Federal Reserve’s preferred inflation gauge showed that prices rose at the fastest pace in nearly a year. Friday’s Personal Consumption Expenditures Price Index release showed that inflation rose in December at an annual rate of 2.9%, the highest since March 2024. The PCE report came a week after the Consumer Price Index (CPI), showed that inflation eased to 2.4% in January.
The price of U.S. crude oil climbed nearly 6% for the week after rising to the highest level in more than six months. Oil was trading above $66 per barrel, up 17% year to date, amid rising tensions between the United States and Iran.
Bitcoin fell for the fourth week out of the past five, although the price of the most widely traded cryptocurrency stabilized relative to a sell-off that began in late January. On Friday, Bitcoin was trading below $68,000—down about 23% year to date and well below the record high of about $126,000 set last October.
U.S. large-cap growth stocks narrowed their year-to-date performance deficit relative to their value counterparts, as a growth equity benchmark outperformed a value index. The growth benchmark, the Russell 1000 Growth Index, finished around 1.5% higher for the week, while the Russell 1000 Value Index added 0.7%.
Yields of U.S. government bonds rose modestly but remained well below a recent peak reached a couple of weeks earlier. The yield of the 10-year U.S. Treasury finished the week around 4.08%, up from the year-to-date low of 4.05% at the end of the previous week. As recently as January 20, the yield had climbed as high as 4.31%, the highest since last August.
Insights: What the Tariff Ruling Means for Markets
The Supreme Court’s decision carries significance less for its immediate economic impact and more for what it signals about trade policy uncertainty.
First, the ruling reduces the probability of broad, unilateral tariff expansion in the near term. Markets generally favor predictability. Limiting executive trade discretion removes one potential source of risk premium embedded in multinational earnings expectations.
Second, the decision modestly reduces upside risks to goods inflation. Tariffs function economically as a tax on imports and often flow through to consumer prices. At a time when services inflation remains sticky, but goods prices have cooled, removing the risk of renewed tariff escalation helps stabilize inflation expectations.
Sector implications may be meaningful over time. Multinational industrial firms, semiconductor manufacturers, and consumer goods companies dependent on global supply chains benefit from reduced cost uncertainty. Conversely, certain domestic industries that previously benefited from tariff protection may face renewed competitive pressure.
Markets will now watch whether Congress attempts legislative responses or whether narrower trade measures emerge in the future. Trade policy remains a structural wildcard, but one layer of immediate uncertainty has been reduced.
GDP: Slowing But Not Stalling
The fourth-quarter GDP report showed a clear deceleration from Q3’s 4.4% pace to 1.4%. While that slowdown was meaningful, the composition suggests normalization rather than deterioration.
Several factors contributed to the deceleration:
- Reduced federal spending tied to the Q4 government shutdown.
- Slower inventory accumulation following strong Q3 rebuilding.
- Moderation in consumer spending from elevated summer levels.
Importantly, business investment remained constructive, particularly in technology and infrastructure categories. Capital expenditures tied to artificial intelligence infrastructure and data center expansion continue to support fixed investment. Net exports and inventory swings contributed to volatility in headline growth but did not necessarily reflect underlying demand weakness.
A 1.4% growth rate is below longer-term trend but consistent with an economy transitioning from an overheated expansion toward mid-cycle normalization. It does not currently signal a contraction.
Employment: A Soft Landing Still Intact
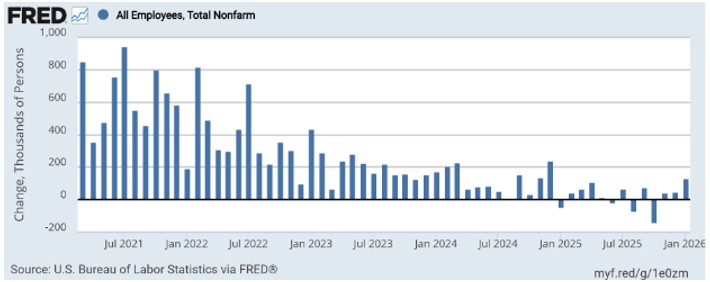
January’s 130,000 job gain—more than double expectations—reinforces that the labor market is cooling but not collapsing. The unemployment rate dipped to 4.3%, and labor force participation remains broadly stable.
Wage growth has moderated from peak levels but remains above pre-pandemic norms. That moderation supports continued disinflation without triggering sharp household income deterioration.
This is broadly consistent with the “soft landing” scenario policymakers have attempted to engineer:
- Slower but positive job creation.
- Gradual disinflation.
- No spike in unemployment.
As long as payroll growth remains positive and household balance sheets remain intact, the economy retains forward momentum—even if that momentum is slower than in prior quarters.
Inflation Crosscurrents
The divergence between CPI (2.4%) and headline PCE (2.9%) underscores the uneven nature of the disinflation process. Goods inflation has cooled significantly, while services categories remain more persistent.
This creates a nuanced backdrop for policy. Slower GDP growth argues for eventual rate cuts. Sticky PCE readings argue for patience. Markets appear to be balancing those forces, with Treasury yields moderating from recent highs but not collapsing.
Inflation expectations remain anchored, but the path back toward the Federal Reserve’s 2% objective is likely to be gradual rather than linear.
Federal Reserve: Between Patience and Flexibility
The Fed now faces a delicate balancing act:
- Growth has slowed but remains positive.
- Employment remains healthy but is no longer accelerating.
- Inflation has cooled but shows pockets of persistence.
If growth continues trending toward 1–2% while inflation gradually eases, rate cuts later this year remain plausible. However, policymakers will likely seek additional confirmation before shifting stance.
Bond market behavior suggests investors believe growth risks marginally outweigh inflation risks at present. Still, policy remains data-dependent, and volatility in expectations should be expected.
Market Structure: Still in a Range
Despite last week’s rebound, the S&P 500 remains confined within a roughly 6% range that reflects elevated but contained volatility.
This environment is consistent with markets digesting:
- AI-driven capital reallocation.
- Slowing but positive growth.
- Trade policy recalibration.
- Mixed inflation signals.
Range-bound markets can be frustrating, but they are often characteristic of transitional phases between economic leadership.
Breakouts from prolonged consolidation typically require a decisive catalyst, either a clear reacceleration in earnings growth, a meaningful policy shift or both.
Final Thoughts
The Supreme Court’s tariff ruling removes one layer of uncertainty but does not eliminate the broader volatility that has characterized early 2026. Growth has slowed but remains positive. Employment is cooling but remains healthy. Inflation is moderating, though unevenly.
This is not an environment of crisis. It is an environment of transition.
Markets are adjusting from an overheating economy and narrow leadership to a slower, broader expansion. Periods like this often feel unstable because narratives shift quickly and sector leadership rotates frequently. Volatility and range-bound trading may persist over the coming quarters as investors evaluate AI investment returns, the pace of disinflation, and Federal Reserve timing. Yet beneath that volatility, corporate earnings remain solid, consumer resilience persists, and business investment continues—particularly in infrastructure and technology.
Disciplined allocation, patience, and long-term perspective remain more important than reacting to weekly headlines.
It is our aim at Asbury Wealth Partners that you find the market commentary we provide informative and useful. As our success grows mainly through referrals from our clients, we encourage you to share this weekly newsletter with your friends, family, and colleagues. If you are a client, we thank you for your business and your confidence. If you are not yet a client, we encourage you to contact us today and explore how our team may be able to add value to your unique financial situation.
Thank You,
Jeff
~~~~~~~~~~~~~~~~~~~~~~~
Jeffrey S. Markewich
Wealth Advisor
Off – 719-548-8103
Cell - 719-357-7747
Text – 702-493-9678
TF - 888-328-7655
~~~~~~~~~~~~~~~~~~~~~~~
An Introduction to Your Friends & Family
is the Greatest Compliment You Can Give
Jeffrey Markewich is a Registered Representative with, and securities and advisory services offered through LPL Financial, a registered investment advisor, Member FINRA/SIPC.
The information contained in this email message is being transmitted to and is intended for the use of only the individual(s) to whom it is addressed. If the reader
of this message is not the intended recipient, you are hereby advised that any dissemination, distribution or copying of this message is strictly prohibited. If you have received this message in error, please reply and you will be removed.
These views are those of the author, not of the broker-dealer or its affiliates. This material contains an assessment of the market and economic environment at a specific point in time and is not intended to be a forecast of future events, or a guarantee of future results. All investments involve risk, including loss of principal. Forward-looking statements are subject to certain risks and uncertainties. Actual results, performance, or achievements may differ materially from those expressed or implied. Information is based on data gathered from what we believe are reliable sources.
The NASDAQ Composite Index measures all NASDAQ domestic and non-U.S. based common stocks listed on The NASDAQ Stock Market. The market value, the last sale price multiplied by total shares outstanding, is calculated throughout the trading day, and is related to the total value of the Index.
S&P 500 – A capitalization-weighted index of 500 stocks designed to measure performance of the broad domestic economy through changes in the aggregate market value of 500 stocks representing all major industries.
The Dow Jones Industrial Average is comprised of 30 stocks that are major factors in their industries and widely held by individuals and institutional investors.
The Russell 2000 Index is an unmanaged index generally representative of the 2,000 smallest companies in the Russell 3000 index, which represents approximately 10% of the total market capitalization of the Russell 3000 Index.
The CBOE Volatility Index? (VIX?) is meant to be forward looking, showing the market's expectation of 30-day volatility in either direction, and is considered by many to be a barometer of investor sentiment and market volatility, commonly referred to as “Investor Fear Gauge”.
International invesnvolves special risks such as currency fluctuation and political instability and may not be suitable for all investors.
ll indexes referenced are unmanaged. The volatility of indexes could be materially different from that of a client’s portfolio. Unmanaged index returns do not reflect fees, expenses, or sales charges. You cannot invest directly in an index. Consult your financial professional before making any investment decision.
There is no guarantee that a diversified portfolio will enhance overall returns or outperform a non-diversified portfolio. Diversification does not protect against market risk.
Asset allocation does not ensure a profit or protect against a loss.
The Consumer Price Indexes (CPI) program produces monthly data on changes in the prices paid by urban consumers for a representative basket of goods and services (Source: U.S. Department of Labor).
The Gross Domestic Product (GDP) is a comprehensive measure of U.S. economic activity. GDP measures the value of the final goods and services produced in the United States (without double counting the intermediate goods and services used up to produce them). Changes in GDP are the most popular indicator of the nation's overall economic health.
Government bonds and Treasury bills are guaranteed by the US government as to the timely payment of principal and interest and, if held to maturity, offer a fixed rate of return and fixed principal value.
LPL Tracking #1068728