


Market Insights
Observations & Insights – February 17, 2026
Cars & Coffee is this Saturday (see attached).
10am to Noon in our parking lot… weather permitting!
(if it's dry, give us a try)
Markets Retreat
The major U.S. stock indexes fell around -1% to -2% as shifting narratives about AI prospects and technology stocks continued to drive the broader market. For the S&P 500, it was the fourth negative week out of the past five, although the previous declines were all less than -1%.
Key Points
- Markets fell last week between -1% and -2%.
- January job growth of 130,000 more than doubled expectations of 55,000.
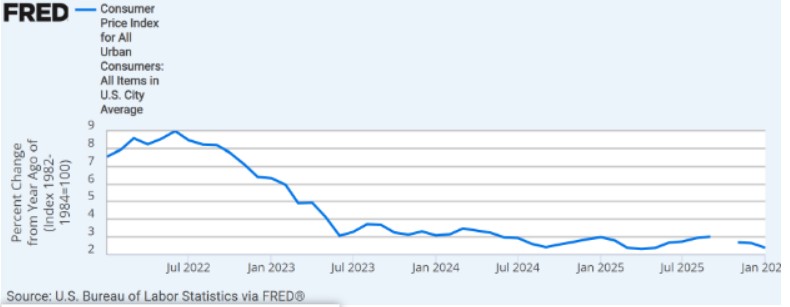
- Inflation cooled to 2.4%, the lowest reading since May 2025.
- Market volatility continued to expand as AI's reach into white-collar jobs generated uncertainty.
- The S&P 500 continues trading in a range between 6,750 and 7,150.
Observations: Good News on Jobs and Inflation
U.S. jobs growth exceeded expectations, helping to ease recent concerns about labor market weakness. The gain of 130,000 jobs in January was more than double the number that most economists had forecast and up from 48,000 in December. January’s unemployment rate slipped to 4.3% from 4.4% the previous month.
Friday’s Consumer Price Index report extended a recent trend of slightly cooler-than-expected inflation. CPI rose at an annual rate of 2.4% in January, down from 2.7% the previous month, and the lowest figure since May 2025. Economists had forecast inflation of 2.5% in the latest month.
A Japanese stock benchmark surged nearly 6% for the week to a record high following an election result that gave the ruling party of Prime Minister Sanae Takaichi a supermajority in the nation’s Lower House. Japan’s market has recently been lifted by prospects of higher fiscal spending, tax relief, and a more assertive economic growth agenda.
Prices of U.S. government bonds rose, sending yields lower, after softer-than-expected inflation data boosted investor optimism about the prospect of additional interest rate cuts in the coming months. The yield of the 10-year U.S. Treasury finished the week at a year-to-date low of around 4.05%, down from about 4.20% at the end of the previous week.
With earnings season nearly three-quarters completed as of Friday, overall earnings growth remained well above analysts’ expectations relative to forecasts before the start of the reporting period. S&P 500 companies’ earnings were expected to rise by an average of 13.2% versus a forecast for about 8.3% growth as of December 31, according to FactSet.
December sales at U.S. retailers were essentially unchanged relative to the previous month. The flat result from the peak month of the holiday shopping season was well below the expectations of most economists, who had projected a month-to-month sales increase of around 0.4%.
The GDP report scheduled for release on Friday will show whether the U.S. economy’s recent rapid growth extended into last year’s fourth quarter. The government’s release of its initial GDP estimate follows the 4.4% annual growth rate recorded in the third quarter, which was the fastest in two years.
Insights: Navigating a Period of Uncertainty
This week's economic data painted a picture of an economy that remains fundamentally sound even as it slows from the overheated conditions of previous years. Job growth that more than doubled expectations, combined with inflation continuing its downward trajectory, represents the type of "soft landing" scenario the Federal Reserve has been engineering for the past two years. The labor market is cooling but not collapsing, and price pressures are moderating without indicating economic weakness. Job creation is happening primarily in the private sector as government employee headcounts continue to trend lower, as shown in the chart below.
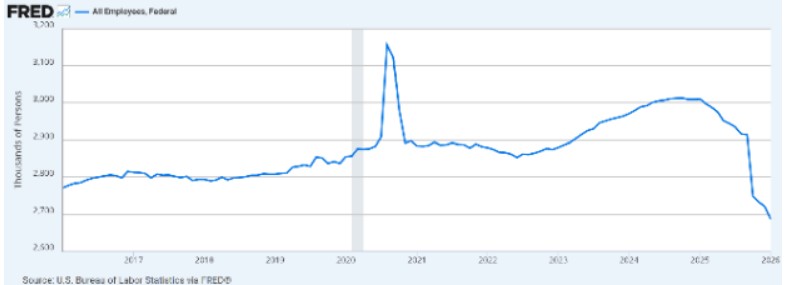
This combination should allow the Fed to resume rate cuts later this year without concern about reigniting inflation.
Yet beneath this positive economic backdrop, markets are exhibiting characteristics that suggest we may be entering what could be the most volatile period on quite some time. The S&P 500 currently trades in a range roughly bounded by 7,150 on the upper end and 6,750 on the lower end, a weekly expected range of 400 points, or approximately 6%. While new all-time highs remain entirely possible within this framework, the expanding volatility reflects fundamental uncertainty about how artificial intelligence will reshape the economic landscape over the next 12 to 18 months and beyond.
The conversation around AI has shifted dramatically over the past month from abstract potential to immediate disruption. Growing concerns about white-collar job displacement are generating enormous emotional energy in markets. Emotion, or more precisely, uncertainty, is the fuel for volatility. When investors cannot confidently project which business models will thrive and which will become obsolete, capital moves aggressively and indiscriminately. This dynamic helps explain why the market oscillates sharply day-to-day while making little meaningful progress in either direction at the index level.
The rotation occurring beneath the surface is arguably healthy, even if it feels chaotic. The upper echelon of the technology and AI trade is cycling through leadership, with capital flowing into industries and sectors that had been overlooked during the three-year technology dominance. Value stocks, industrials, financials, and consumer-facing companies are attracting investment not because they are immune to AI disruption, but because their business models appear more tangible and their valuations more reasonable in an environment of heightened uncertainty.
AI's migration into logistics, operational efficiency, and now white-collar professional services represents an inflection point that many observers anticipated would arrive around mid-2026. We are entering that window now, and the associated volatility and uncertainty will likely intensify before clarity emerges. It may take another 12 to 18 months before micro-trends and sentiment shifts provide the market with greater conviction about winners and losers in the AI economy. During this period, three-day trends in either direction may be the best we can achieve before the next reversal kicks in.
The competitive landscape in AI itself is evolving rapidly. While ChatGPT was the first product to truly capture public imagination, companies like Anthropic are now taking the lead on pure technology grounds, particularly in programming capabilities and clarity of output. This shifting leadership within the AI space adds another layer of complexity for investors trying to identify which companies will emerge as long-term winners. The infrastructure layer—semiconductors, data centers, power generation—appears more certain, which helps explain the resilience in chip stocks despite broader technology weakness.
The massive increase in AI capital expenditure announced by companies like Alphabet deserves careful interpretation. On one hand, $185 billion in infrastructure spending suggests extraordinary confidence in AI's transformative potential, and a significant boost to US GDP. On the other, such spending raises legitimate questions about returns on investment and competitive positioning. If multiple companies are simultaneously investing hundreds of billions in similar infrastructure, will any achieve sustainable competitive advantages? Or are they collectively overbuilding capacity that will lead to margin compression? These questions cannot be answered definitively today, which is precisely why volatility remains elevated.
Final Thoughts
Markets appear to be entering a new phase, one defined less by narrow AI-driven momentum and more by balance. Inflation is cooling gradually. The labor market is softening but not collapsing. Earnings remain solid. Financial conditions have eased modestly.
Volatility earlier this month served as a reset, not a reversal. As always, short-term turbulence can feel uncomfortable, but it often creates opportunity. The long-term backdrop for disciplined investors remains constructive.
While leadership may continue to shift in the weeks ahead, the underlying drivers of this expansion—corporate profitability, productivity gains, infrastructure investment, and resilient consumer activity—remain intact.
It is our aim at Asbury Wealth Partners that you find the market commentary we provide informative and useful. As our success grows mainly through referrals from our clients, we encourage you to share this weekly newsletter with your friends, family, and colleagues. If you are a client, we thank you for your business and your confidence. If you are not yet a client, we encourage you to contact us today and explore how our team may be able to add value to your unique financial situation.
Thank You,
Jeff
~~~~~~~~~~~~~~~~~~~~~~~
Jeffrey S. Markewich
Wealth Advisor
Off – 719-548-8103
Cell - 719-357-7747
Text – 702-493-9678
TF - 888-328-7655
~~~~~~~~~~~~~~~~~~~~~~~
An Introduction to Your Friends & Family
is the Greatest Compliment You Can Give
Jeffrey Markewich is a Registered Representative with, and securities and advisory services offered through LPL Financial, a registered investment advisor, Member FINRA/SIPC.
The information contained in this email message is being transmitted to and is intended for the use of only the individual(s) to whom it is addressed. If the reader
of this message is not the intended recipient, you are hereby advised that any dissemination, distribution or copying of this message is strictly prohibited. If you have received this message in error, please reply and you will be removed.
These views are those of the author, not of the broker-dealer or its affiliates. This material contains an assessment of the market and economic environment at a specific point in time and is not intended to be a forecast of future events, or a guarantee of future results. All investments involve risk, including loss of principal. Forward-looking statements are subject to certain risks and uncertainties. Actual results, performance, or achievements may differ materially from those expressed or implied. Information is based on data gathered from what we believe are reliable sources.
The NASDAQ Composite Index measures all NASDAQ domestic and non-U.S. based common stocks listed on The NASDAQ Stock Market. The market value, the last sale price multiplied by total shares outstanding, is calculated throughout the trading day, and is related to the total value of the Index.
S&P 500 – A capitalization-weighted index of 500 stocks designed to measure performance of the broad domestic economy through changes in the aggregate market value of 500 stocks representing all major industries.
The Dow Jones Industrial Average is comprised of 30 stocks that are major factors in their industries and widely held by individuals and institutional investors.
The Russell 2000 Index is an unmanaged index generally representative of the 2,000 smallest companies in the Russell 3000 index, which represents approximately 10% of the total market capitalization of the Russell 3000 Index.
The CBOE Volatility Index? (VIX?) is meant to be forward looking, showing the market's expectation of 30-day volatility in either direction, and is considered by many to be a barometer of investor sentiment and market volatility, commonly referred to as “Investor Fear Gauge”.
International investing involves special risks such as currency fluctuation and political instability and may not be suitable for all investors.
All indexes referenced are unmanaged. The volatility of indexes could be materially different from that of a client’s portfolio. Unmanaged index returns do not reflect fees, expenses, or sales charges. You cannot invest directly in an index. Consult your financial professional before making any investment decision.
There is no guarantee that a diversified portfolio will enhance overall returns or outperform a non-diversified portfolio. Diversification does not protect against market risk.
Asset allocation does not ensure a profit or protect against a loss.
The Consumer Price Indexes (CPI) program produces monthly data on changes in the prices paid by urban consumers for a representative basket of goods and services (Source: U.S. Department of Labor).
The Gross Domestic Product (GDP) is a comprehensive measure of U.S. economic activity. GDP measures the value of the final goods and services produced in the United States (without double counting the intermediate goods and services used up to produce them). Changes in GDP are the most popular indicator of the nation's overall economic health.
Government bonds and Treasury bills are guaranteed by the US government as to the timely payment of principal and interest and, if held to maturity, offer a fixed rate of return and fixed principal value.
LPL Tracking # 1065693