Market Insights 7/27/26
Observations & Insights – July 27, 2026
Markets Modestly Lower
U.S. stocks pulled back last week, with the S&P 500 falling -1.3% and the Nasdaq dropping sharply by nearly -3% amid a severe rout in semiconductor, AI, and large-cap tech shares. Conversely, the energy sector rallied as oil (WTI crude) jumped 9.3% due to escalating U.S.-Iran tensions, while defensive sectors like health care and staples outperformed
Key Points
- Stocks pulled back as energy spiked on Mideast tensions.
- Brent crude oil spiked over $100bbl on Friday.
- Tech earnings came in above expectation, but concerns surround Capex spending.
- Equity valuations are high, supported by earnings growth.
- Fed meeting on deck this week.
Observations: Energy Shocks Spike Bond Yields, Upsetting Global Markets
Escalation in the Middle East conflict and further shipping disruptions in the Persian Gulf and Red Sea lifted oil prices. U.S. crude was trading around $90 per barrel on Friday afternoon, up from roughly $82 at the end of the previous week and $69 as recently as early July. Brent crude spiked over $100 per barrel on Friday, before settling around $98.
Prices of U.S. government bonds fell for the second week in a row, sending yields higher ahead of a U.S. Federal Reserve meeting. The 10-year U.S. Treasury peaked around 4.70% on Thursday—the highest in more than a year and a half—before closing at 4.68% on Friday. Yields of 2- and 30-year Treasuries also surged, reaching 4.33% and 5.17%, respectively, on Friday.
Bond yields pushed higher in key developed markets outside the United States. In the United Kingdom, 10-year government bond yields rose above 5.00% while the equivalent German yield hit its highest level since 2011. Japanese yields recently approached levels last seen in the 1990s.
The recent rise in bond yields is affecting the U.S. housing market, as mortgage rates have climbed to the highest level in nearly a year. The average 30-year fixed mortgage rate rose to 6.58%, according to Freddie Mac’s latest weekly update. The average rate had briefly slipped below 6.00% in February, sparking forecasts of a rebound in home sales, which have recently been in a slump.
The Trump administration on Friday imposed new tariffs on dozens of the United States’ biggest trading partners, including the European Union. The new 10.0% to 12.5% duties follow the expiration of a 10.0% global tariff that the administration had implemented in February 2026 after the U.S. Supreme Court struck down a prior tariff regime.
Earnings season forecasts were adjusted sharply higher after a mega-cap tech company reported better-than-expected results. As of Friday, analysts projected that earnings for S&P 500 companies rose an average 37.9% in the second quarter, up from a 24.8% forecast at the end of the previous week, according to FactSet. The latest forecast was based on the roughly one-quarter of S&P 500 companies that had reported results as of Friday, plus projections for those that had not yet released numbers.
In addition to more quarterly earnings reports, the new week will bring a U.S. Federal Reserve policy meeting that concludes on Wednesday. Investors will be looking for more clarity from new Fed Chair Kevin Warsh. On Thursday, investors will assess an initial estimate of second-quarter GDP growth and June’s inflation rate, as measured by the Personal Consumption Expenditures Price Index.
Insights: Are Valuations Too High?
We write about equity valuations quite a bit, but outside of our industry it is rare that valuations are mentioned at a market or index level. Typically, when valuations do come up, it is for the wrong reasons, because they are high. We are seeing more and more valuation-focused comments today as the market continues to charge higher. As we have written about many times, as long as that charge higher is met with growing earnings, then valuations stay in check, and the runway for future returns remains long. Historically, it is better to consider relative valuations – i.e., how cheap or expensive asset classes or sectors are relative to the overall market. This assumes investors are not using valuations to be in or out of the market (which they should not do), but today we want to look at one measure of absolute valuations that has garnered concern in some areas of the market.
Robert Shiller created the CAPE, or PE10, ratio and was awarded a Nobel Prize for “empirical analysis of asset prices,” which included the predictability of this CAPE ratio. This metric is an adjustment of the standard price-to-earnings ratio that is widely looked at. CAPE divides the current inflation-adjusted price of the S&P 500 by the past 10-years of average inflation-adjusted earnings to arrive at what is intended to be a “smoother” average than a standard trailing 12- or forward 12-month price dvided into earnings number. Shiller’s work was based on the predictability of this ratio for market returns 10-years forward. While that is good in theory, 10-years is a long time in the market, and not something that should impact an investors willingness to invest. No valuation methodology is perfect, and CAPE is far from it (it does not account for earnings growth or the discount rate, can be artificially inflated or depressed by write-downs, the mean-reverting average keeps going higher, etc.), but let’s dive into what high valuations can mean going forward and what investors should do about it (if anything).
Looking at history (back to 1900), it is no surprise that a low CAPE ratio implies higher forward returns, and vice versa. If it did not, no one would be looking at this ratio! However, there are many things to glean from these numbers as displayed below. First is the middle line – the market returns over rolling 1- and 5-year periods – always a good reminder that a 10% return that is positive more than 90% of the time over 5-year periods is something we all benefit from. The concern comes in when valuations (as measured by CAPE) are elevated. Periods above a ratio of 20 and also above 25 see lower expected returns going forward – but not that much lower. A 7% annualized return over 5 years is still a cumulative return of over 40%, and returns are positive over the next year and 5 years nearly three-fourths of the time. Those numbers are simply too positive to ignore, and definitely not worth missing by being out of the market. And of course, this is just for the S&P 500 – typically when valuations get elevated in one asset class, market leadership rotates.
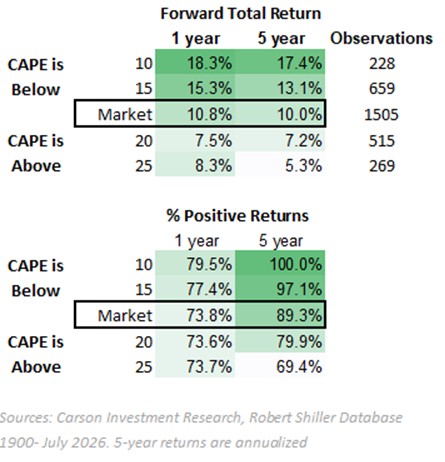
What about all-time highs? If you take the CAPE ratio back to 1900 and then look at the numbers at each new all-time CAPE high, forward 1-year returns are remarkably still positive, nearly 72% of the time (with a 7% average)! As you stretch that over 5 years, returns do diminish, but in just 32 observations of the CAPE at all-time highs, forward returns are still positive over 3-5 years 40% of the time. Today’s CAPE ratio is still below all-time highs.
The most important takeaway from high valuations and so-called bubbles (which we discussed a few of weeks ago) is this: valuations can stay high for a long period of time (indeed they can always go higher) and stocks follow earnings over time. The latest reports from US companies of second quarter earnings show earnings are set to grow close to 38% on a year over year basis. These are real numbers. We believe, based on our observations of the companies and indexes we are invested in, that most analysts are behind in their estimates of future earnings growth. This is one reason we raised our end of year target on the S&P 500 last week to between 7850 and 8100.
Final Thoughts
Valuations are high, so what do you do? You remain invested, but maybe take a second look at what you are invested in. We are always doing that in portfolios – balancing momentum, growth, valuations, and expectations of economic or policy impact across the positions we are invested in. Each has different time frames and considerations. The old saying always rings true – time in the market beats timing the market every time.
It is our aim at Asbury Wealth Partners that you find the market commentary we provide informative and useful. As our success grows mainly through referrals from our clients, we encourage you to share this weekly newsletter with your friends, family, and colleagues. If you are a client, we thank you for your business and your confidence. If you are not yet a client, we encourage you to contact us today and explore how our team may be able to add value to your unique financial situation.
Thank You,
Jeff
~~~~~~~~~~~~~~~~~~~~~~~
Jeffrey S. Markewich
Wealth Advisor
Off – 719-548-8103
Cell - 719-357-7747
Text – 702-493-9678
TF - 888-328-7655
~~~~~~~~~~~~~~~~~~~~~~~
An Introduction to Your Friends & Family
is the Greatest Compliment You Can Give
Jeffrey Markewich is a Registered Representative with, and securities and advisory services offered through LPL Financial, a registered investment advisor, Member FINRA/SIPC.
The information contained in this email message is being transmitted to and is intended for the use of only the individual(s) to whom it is addressed. If the reader
of this message is not the intended recipient, you are hereby advised that any dissemination, distribution or copying of this message is strictly prohibited. If you have received this message in error, please reply and you will be removed.
These views are those of the author, not of the broker-dealer or its affiliates. This material contains an assessment of the market and economic environment at a specific point in time and is not intended to be a forecast of future events, or a guarantee of future results. All investments involve risk, including loss of principal. Forward-looking statements are subject to certain risks and uncertainties. Actual results, performance, or achievements may differ materially from those expressed or implied. Information is based on data gathered from what we believe are reliable sources.
The opinions voiced in this material are for general information only and are not intended to provide specific advice or recommendations for any individual. All performance referenced is historical and is no guarantee of future results. All indices are unmanaged and may not be invested into directly.
The NASDAQ Composite Index measures all NASDAQ domestic and non-U.S. based common stocks listed on The NASDAQ Stock Market. The market value, the last sale price multiplied by total shares outstanding, is calculated throughout the trading day, and is related to the total value of the Index.
S&P 500 – A capitalization-weighted index of 500 stocks designed to measure performance of the broad domestic economy through changes in the aggregate market value of 500 stocks representing all major industries.
The Dow Jones Industrial Average is comprised of 30 stocks that are major factors in their industries and widely held by individuals and institutional investors.
The Russell 2000 Index is an unmanaged index generally representative of the 2,000 smallest companies in the Russell 3000 index, which represents approximately 10% of the total market capitalization of the Russell 3000 Index.
The CBOE Volatility Index? (VIX?) is meant to be forward looking, showing the market's expectation of 30-day volatility in either direction, and is considered by many to be a barometer of investor sentiment and market volatility, commonly referred to as “Investor Fear Gauge”.
International investing involves special risks such as currency fluctuation and political instability and may not be suitable for all investors.
All indexes referenced are unmanaged. The volatility of indexes could be materially different from that of a client’s portfolio. Unmanaged index returns do not reflect fees, expenses, or sales charges. You cannot invest directly in an index. Consult your financial professional before making any investment decision.
There is no guarantee that a diversified portfolio will enhance overall returns or outperform a non-diversified portfolio. Diversification does not protect against market risk.
Asset allocation does not ensure a profit or protect against a loss.
The Consumer Price Indexes (CPI) program produces monthly data on changes in the prices paid by urban consumers for a representative basket of goods and services (Source: U.S. Department of Labor).
The Gross Domestic Product (GDP) is a comprehensive measure of U.S. economic activity. GDP measures the value of the final goods and services produced in the United States (without double counting the intermediate goods and services used up to produce them). Changes in GDP are the most popular indicator of the nation's overall economic health.
Government bonds and Treasury bills are guaranteed by the US government as to the timely payment of principal and interest and, if held to maturity, offer a fixed rate of return and fixed principal value.
LPL Tracking # 1147545