


Market Insights 6/22/26
Observations & Insights – June 21, 2026
Thank you to all who joined us for Cars & Coffee this past Saturday. Great turnout!
Next Cars & Coffee will be July 18th from 10am to Noon in our parking lot.
Markets Rise in Volatile Week
Financial markets held up quite well in a holiday-shortened week, despite a hawkish surprise from the Fed and continued geopolitical uncertainty. The S&P 500 and Dow Jones Industrial Average gained about 1.4%, while the Nasdaq Composite climbed 3.1%, leading the major indexes thanks to continued strength in AI and semiconductor stocks.
Key Points
- Stock markets gained after another volatile week.
- The Fed signaled higher interest rates for longer than expected.
- Middle East tensions eased, which sent oil prices lower, a potential moderator of inflation.
Observations: Fed More Hawkish Than Expected
Markets traded higher this week, with gains concentrated in the semiconductor industry and AI beneficiaries. Mega-cap tech’s strength lifted the S&P 500 +1.4% and the Nasdaq Composite +3.1%, while the equal-weight S&P 500 was essentially flat at +0.1%. Technology led all S&P 500 sectors at +4.4%, followed by Industrials with a +3.2% return.
While about half the sectors rose, only three of the eleven beat the index, with energy the clear laggard at -5.9%. Bonds ended the week flat, with the long end the exception, which outperformed as falling oil prices eased inflation fears. Commodities fell sharply, with oil falling -13% as the U.S. and Iran agreed to a framework to end the conflict. The U.S. dollar strengthened, while Bitcoin continued to trade lower.
Kevin Warsh chaired his first meeting as Fed chair, and the committee left the federal funds rate unchanged at 3.50% to 3.75%. The shift was in the messaging. Updated projections show officials now expect rates to end 2026 higher than they are today, a reversal from March, when most still penciled in a cut. Nine of eighteen officials now forecast at least one hike this year. The Fed also raised its year-end inflation forecast after consumer prices rose +4.2% from a year ago in May, the hottest reading since 2023
Oil Prices Decline as U.S. & Iran Announce Peace Deal. The two sides announced an agreement to end the fighting that began in late February and reopen the Strait of Hormuz, the waterway that carries nearly 20% of the world’s oil. Oil dropped on the news, with U.S. crude sliding back into the mid-$70s for the first time since early March. Treasury yields also declined as falling oil prices eased inflation concerns. Despite the agreement, key issues, including Iran’s nuclear program, are still unresolved.
Retail sales rose +0.9% from the prior month, nearly double what economists had expected, and were up +6.9% from a year earlier. Higher gasoline prices lifted sales at gas stations, but spending held up across other categories too. A core measure that strips out the most volatile categories and feeds into economic growth figures rose +0.7%, a sign that the underlying pace of spending remains solid.
SpaceX Completed the Largest IPO in History. The company went public last Friday, raising roughly $75 billion. Its stock jumped +19% on the first day of trading, valuing the company at more than $2 trillion, even though it is not yet profitable. Investors are treating the debut as an early test of appetite for a coming wave of artificial intelligence listings, with OpenAI and Anthropic among the companies reportedly preparing to go public later this year. A strong first day suggests public markets are willing to absorb very large companies that are not yet making money, a useful read on investor confidence. It also clears the way for the bigger wave of technology IPOs expected later this year.
Next week's calendar is heavily focused on inflation and economic growth. Following a more hawkish Federal Reserve meeting, investors will be watching Thursday's PCE inflation report for evidence that price pressures continue to move lower. If inflation cooperates while economic growth remains positive, it would strengthen the case that the economy is achieving the rare combination of moderating inflation and continued expansion, a backdrop that has historically been supportive for both stocks and bonds.
Insights: Mixed Messages from the Fed Even as the Economy Runs Hot
There is always uncertainty around a new Fed chair and how they will handle the communication of monetary policy. But it is usually more around style rather than substance. In Kevin Warsh’s case, the concern is substance, or lack of it. While 12 FOMC members set policy, the chair plays the central role in explaining the thinking behind decisions and how the Fed would respond under different scenarios. The Fed is ultimately managing two-sided risk: higher unemployment and higher inflation. Markets need confidence that it can do that, especially during a shock.
The chair also clarifies the Fed’s reaction function: what it does, why it does it, and how it responds as the data changes. There is always uncertainty around policy, but ideally that uncertainty comes from the economy, not confusion about how the Fed interprets it.
Warsh just completely disengaged from that framework. By rejecting “forward guidance,” he may be trying not to telegraph the next move, which is reasonable when even Fed officials do not know the timing. But he also left markets with little sense of the Fed’s reaction function. The uncertainty band around policy just widened, which means more volatility.
Instead, Warsh is focused on creating task forces covering Fed communication, the balance sheet, data, productivity, jobs, and the inflation framework. That is a lot. He will be busy building commissions while markets are looking for clarity.
The Fed Holds Rates Steady, but Dot Plot Shows a Hawkish Pivot
The problem is that Warsh is effectively stepping back from leading the Fed, rather than coordinating a consistent message across differing views within the committee. The other 18 Fed officials will keep offering their own interpretations of the data and the Fed’s reaction function, potentially adding to confusion. Who leads now? Which data points take priority? And are markets supposed to look to new private data sources, which may be even less reliable than the public ones?
Case in point: the June meeting. The Fed held rates steady in the 3.50%–3.75% range, as expected. But Warsh’s new no-guidance approach was obvious in the statement. It was shorter, simpler, and largely limited to what the Fed had just done: leave policy unchanged. That may reduce the risk of overcommitting, but it also strips away useful context. Markets got the decision, but not much of the reasoning behind it.
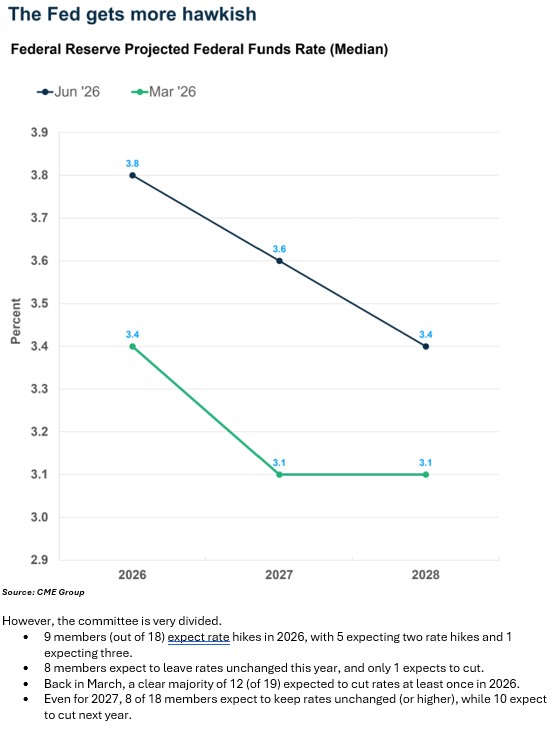
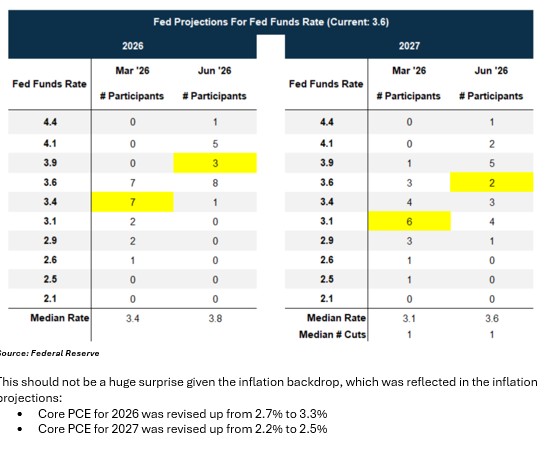
The June meeting was also important because it is one of the four meetings in which the Fed puts out their Summary of Economic Projections (including the “dot plot” of policy rate expectations). The last one was in March, and all eyes were on what the dot plot would show.
The bad news is that the dots took a much more hawkish turn relative to March. At the same time, Warsh did not submit a dot for himself, which meant we have only 18 dots.
- The median expected policy rate for 2026 was increased from 3.4% to 3.9%, i.e. a move from one cut to one hike.
- The median expected policy rate for 2027 was increased from 3.1% to 3.6%, which still reflects one cut relative to the 2026 expectation.
Source: CME Group
However, the committee is very divided.
- 9 members (out of 18) expect rate hikes in 2026, with 5 expecting two rate hikes and 1 expecting three.
- 8 members expect to leave rates unchanged this year, and only 1 expects to cut.
- Back in March, a clear majority of 12 (of 19) expected to cut rates at least once in 2026.
- Even for 2027, 8 of 18 members expect to keep rates unchanged (or higher), while 10 expect to cut next year.
Source: Federal Reserve
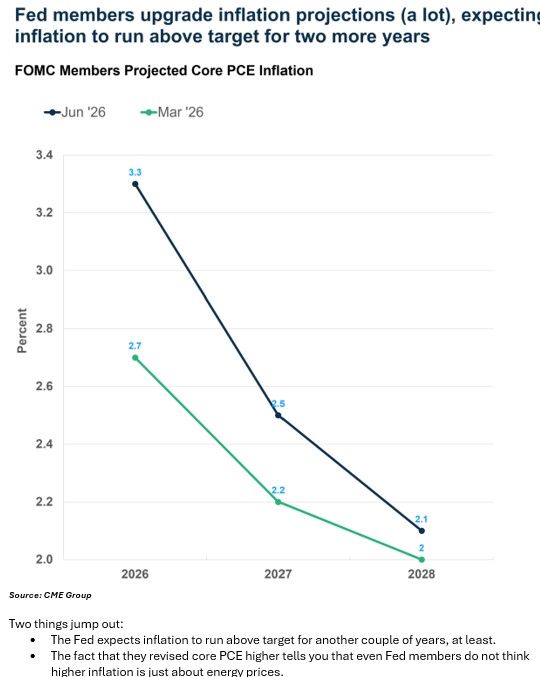
This should not be a huge surprise given the inflation backdrop, which was reflected in the inflation projections:
- Core PCE for 2026 was revised up from 2.7% to 3.3%
- Core PCE for 2027 was revised up from 2.2% to 2.5%
Source: CME Group
Two things jump out:
- The Fed expects inflation to run above target for another couple of years, at least.
- The fact that they revised core PCE higher tells you that even Fed members do not think higher inflation is just about energy prices.
Note that core PCE is expected to hit 3.5% year over year in May and run at an annualized pace of 3.8% over the last three months. There’s a good chance that core PCE will be higher than 3.3% by year end.
Source: FRED
Policy Is Actually Dovish, While the Economy Runs Hot
It sounds odd to call policy dovish after a hawkish pivot in the dot plot. But policy has to be judged against the Fed’s own growth and inflation projections (which we have for the moment).
One way to measure how easy or tight policy is: expected “real” policy rates, i.e. expected policy rate minus expected inflation. The Fed’s long run policy-rate expectation is 3.1% while inflation is expected to settle at 2%, implying a “neutral” real rate of 1.1%. Against that baseline, the Fed’s thinking (excluding Warsh) actually became easier from March to June:
- In March, the median rate projection for 2026 was 3.4% while core PCE was projected at 2.7%, i.e. a real rate of 0.7%.
- In June, the median rate projection rose to 3.8%, but the core PCE projection rose even more, to 3.3%, implying a real rate of just 0.5%.
In other words, policy was already expected to be on the easy side in March. By June, it had become even easier. The current policy rate is 3.6%, while core PCE is running at 3.5% year over year, implying a real rate of just 0.1%. Using headline PCE at 4.1%, the real rate would be negative. Either way, policy is well below the Fed’s estimated neutral real rate of 1.1%.
And remember, the 3.8% median rate projection for 2026 is just that, the median of 18 officials. Only half expect hikes this year, which means there is still meaningful uncertainty around whether any hikes happen at all. A Fed that holds rates steady while inflation remains elevated is not running restrictive policy.
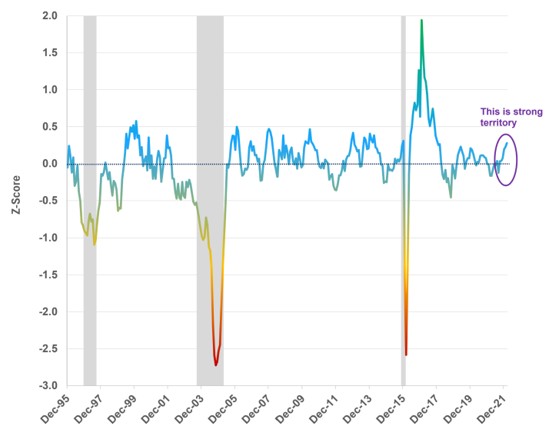
That would be more defensible if labor market risks were rising, but they are not. As I wrote a couple of weeks ago, the labor market has clearly stabilized, and if anything, things may be improving. Core retail sales (excluding things like gasoline and autos) are up 8.7% annualized over the last three months. The Leading Economic Index, which captures a diversified group of economic indicators, points to robust activity. Yes, these are nominal measures, but it gets to the point that inflation is hot.
US Economic Activity Running Strong, with No Sign of Deterioration
Source: Carson Investment Research
More Uncertainty in Markets
The immediate reaction from markets to Warsh’s commentary (or lack thereof) was not positive. The S&P 500 fell 1.2% on the day, though this reversed once the focus shifted back to AI. But the action in the bond market was more telling. Treasury yields climbed, especially for shorter maturities. The 2-year yield rose to 4.15% (from 4.05), the highest we have seen this year. The 10-year yield saw relatively less movement but is still at 4.43%, well above levels we saw before the war (close to 3.95%).
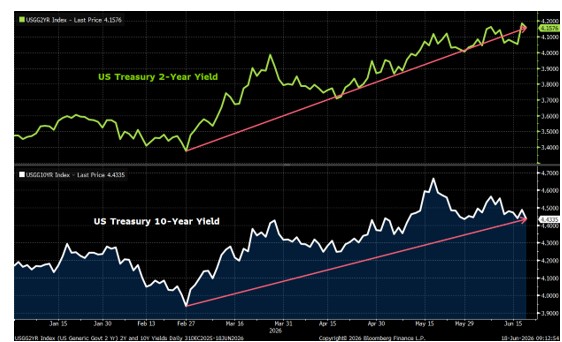
Source: Bloomberg
Higher yields get to the fact that inflation is running hot, and the jump in shorter-term yields tells you that markets expect the Fed to raise rates this year. But there is enormous uncertainty around this as well:
- The probability of a rate hike in July jumped from 10% to 32%.
- The probability of a rate hike by October surged from 42% to 100%, a rate hike is fully priced in.
- The probability of a rate by December jumped from 84% to 150%, implying one hike is fully priced in and there’s 50% probability of a second.
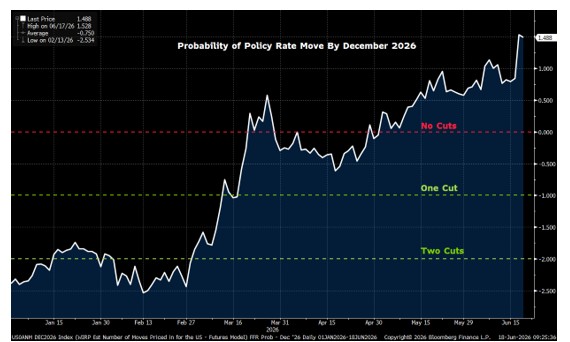
Source: Bloomberg
The cost of the war is clear in bond yields, and policy rate pricing. On the eve of the war, markets were pricing in two rate cuts by year end. The outlook is much less clear now. Add in new uncertainty around the Fed’s reaction function and it is not surprising that the probability of a July rate hike (just six weeks away) is closer to a coin flip than zero.
I would not be surprised to see rate hike probabilities move toward 50% before each meeting if three things persist: 1) inflation remains elevated, 2) the Fed Chair stays disengaged from communication, and 3) the rest of the committee remains split between those looking for hikes and those willing to wait out inflation (once again).
Final Thoughts
For now, our base case is that the Fed refrains from hiking (or cutting) this year, with a slim majority choosing to tolerate elevated inflation rather than tighten further. But the confidence band around that view has widened a lot. Policy uncertainty is higher, and markets will have to price that in.
It is our aim at Asbury Wealth Partners that you find the market commentary we provide informative and useful. As our success grows mainly through referrals from our clients, we encourage you to share this weekly newsletter with your friends, family, and colleagues. If you are a client, we thank you for your business and your confidence. If you are not yet a client, we encourage you to contact us today and explore how our team may be able to add value to your unique financial situation.
Thanks as always for reading, and I hope everyone is off to a great start to summer!
Thank You,
Jeff
~~~~~~~~~~~~~~~~~~~~~~~
Jeffrey S. Markewich
Wealth Advisor
Off – 719-548-8103
Cell - 719-357-7747
Text – 702-493-9678
TF - 888-328-7655
~~~~~~~~~~~~~~~~~~~~~~~
An Introduction to Your Friends & Family
is the Greatest Compliment You Can Give
Jeffrey Markewich is a Registered Representative with, and securities and advisory services offered through LPL Financial, a registered investment advisor, Member FINRA/SIPC.
The information contained in this email message is being transmitted to and is intended for the use of only the individual(s) to whom it is addressed. If the reader
of this message is not the intended recipient, you are hereby advised that any dissemination, distribution or copying of this message is strictly prohibited. If you have received this message in error, please reply and you will be removed.
These views are those of the author, not of the broker-dealer or its affiliates. This material contains an assessment of the market and economic environment at a specific point in time and is not intended to be a forecast of future events, or a guarantee of future results. All investments involve risk, including loss of principal. Forward-looking statements are subject to certain risks and uncertainties. Actual results, performance, or achievements may differ materially from those expressed or implied. Information is based on data gathered from what we believe are reliable sources.
The opinions voiced in this material are for general information only and are not intended to provide specific advice or recommendations for any individual. All performance referenced is historical and is no guarantee of future results. All indices are unmanaged and may not be invested into directly.
The NASDAQ Composite Index measures all NASDAQ domestic and non-U.S. based common stocks listed on The NASDAQ Stock Market. The market value, the last sale price multiplied by total shares outstanding, is calculated throughout the trading day, and is related to the total value of the Index.
S&P 500 – A capitalization-weighted index of 500 stocks designed to measure performance of the broad domestic economy through changes in the aggregate market value of 500 stocks representing all major industries.
The Dow Jones Industrial Average is comprised of 30 stocks that are major factors in their industries and widely held by individuals and institutional investors.
The Russell 2000 Index is an unmanaged index generally representative of the 2,000 smallest companies in the Russell 3000 index, which represents approximately 10% of the total market capitalization of the Russell 3000 Index.
The CBOE Volatility Index? (VIX?) is meant to be forward looking, showing the market's expectation of 30-day volatility in either direction, and is considered by many to be a barometer of investor sentiment and market volatility, commonly referred to as “Investor Fear Gauge”.
International investing involves special risks such as currency fluctuation and political instability and may not be suitable for all investors.
All indexes referenced are unmanaged. The volatility of indexes could be materially different from that of a client’s portfolio. Unmanaged index returns do not reflect fees, expenses, or sales charges. You cannot invest directly in an index. Consult your financial professional before making any investment decision.
There is no guarantee that a diversified portfolio will enhance overall returns or outperform a non-diversified portfolio. Diversification does not protect against market risk.
Asset allocation does not ensure a profit or protect against a loss.
The Consumer Price Indexes (CPI) program produces monthly data on changes in the prices paid by urban consumers for a representative basket of goods and services (Source: U.S. Department of Labor).
The Gross Domestic Product (GDP) is a comprehensive measure of U.S. economic activity. GDP measures the value of the final goods and services produced in the United States (without double counting the intermediate goods and services used up to produce them). Changes in GDP are the most popular indicator of the nation's overall economic health.
Government bonds and Treasury bills are guaranteed by the US government as to the timely payment of principal and interest and, if held to maturity, offer a fixed rate of return and fixed principal value.
LPL Tracking # 1128343