


Market Insights - 6/1/26
Observations & Insights – June 1, 2026
Markets Push Higher
The U.S. stock market extended its springtime rebound from the first quarter’s negative results as the S&P 500 recorded its ninth consecutive weekly gain. Led by information technology stocks, the NASDAQ finished 2.4% higher for the week, the S&P 500 added 1.4%, and the Dow gained 0.9%.
Key Points
- The bull market remains remarkably strong, with the S&P 500 extending its winning streak to nine consecutive weeks, one of the strongest stretches in market history.
- The economy continues to grow, but inflation remains stubbornly high.
- The AI investment cycle remains a powerful driver of earnings growth and market performance.
- Bonds are struggling as Treasury yields climb to multi-year highs.
Observations: Inflation Runs Hot, but it is (Still) All About Earnings
May’s U.S. stock market gains were big, though they fell short of the unusually strong results recorded in April. The NASDAQ climbed 8.4% in May, the S&P 500 gained 5.1%, and the Dow rose 2.8%. In April, the NASDAQ and the S&P 500 both recorded double-digit gains, rebounding from negative first-quarter results.
For the second time in three weeks, a monthly report showed U.S. inflation running at the highest level since May 2023. Thursday’s Personal Consumer Expenditures Price Index report showed an annual rate of 3.8% in April, the same headline inflation figure reported a couple of weeks earlier as measured by the Consumer Price Index (CPI). Excluding food and energy prices, April’s core PCE inflation was 3.3%.
Investor optimism over the latest round of U.S.-Iranian negotiations sent oil prices lower for the second week in a row. U.S. crude was trading around $88 per barrel on Friday afternoon, down nearly -10% for the week, and roughly -16% lower for May.
The U.S. economy’s expansion in this year’s first quarter was slower than initially estimated. The Commerce Department reported that GDP grew at an annual rate of just 1.6% in the January-to-March period, down from an initial estimate of 2.0%. The reduction stemmed from downward revisions to consumer spending and investment.
Wall Street analysts’ forecasts for second-quarter earnings have steadily risen over the past couple of months. FactSet reported on Friday that analysts raised their quarterly earnings expectations for S&P 500 companies by 2.5% in April and May. Second-quarter results are set to be released beginning in mid-July.
Stock indexes in South Korea and Japan climbed to record highs on Friday. A South Korean benchmark surged nearly 11% for the week amid optimism over AI-related stocks, while a Japanese index rose nearly 2%.
A jobs report due out on Friday will show whether recent strengthening in the labor market extended into May. In April, the economy added an above-forecast 1115,000 jobs on the heels of March’s gain of 185,000. The back-to-back monthly increases marked a shift from a pattern of alternating job losses and gains seen over the previous 10 months.
Insights: The Market Continues to Follow the Money
We sound like a broken record, but stocks gained again last week as the bull market rolls on. Just a few months ago, many investors were worried that the economy was headed for a slowdown and that a recession was only a matter of time. Instead, we have seen a very different outcome. As we enter the second half of the year, economic growth remains positive, corporate earnings continue to surprise to the upside, and the market has pushed higher despite a steady stream of headlines that might suggest otherwise.
The biggest story remains the same one we have been discussing throughout the year: artificial intelligence. The amount of capital being deployed into AI infrastructure is staggering. Technology companies are spending hundreds of billions of dollars building data centers, purchasing chips, and expanding cloud capacity. That spending is flowing through the economy, supporting corporate revenues, earnings growth, and ultimately stock prices. While we have yet to see the full productivity benefits of AI show up in the economic data, the investment cycle itself is already having a meaningful impact.
At the same time, the economy continues to show surprising resilience. The labor market remains healthy, despite the threat of AI making many jobs obsolete. Unemployment is still near historically low levels while consumers continue to spend. Government spending and fiscal deficits are also providing significant support for economic activity. None of this looks like an economy that is preparing for a recession.
The challenge, however, is inflation. While energy prices and geopolitical tensions have certainly contributed, inflation is proving to be broader and more persistent than many expected. Demand remains strong, spending remains healthy, and companies continue to have pricing power. As a result, the market has shifted from expecting multiple interest rate cuts this year to recognizing that rates may stay higher for longer, and there is even some discussion about whether rate hikes could become necessary.
This creates an unusual environment where stocks and bonds are telling two different stories. Stocks continue to focus on strong earnings growth and the opportunities created by AI, while bonds are focused on inflation, government deficits, and the possibility that interest rates remain elevated for longer than expected. Rising Treasury yields are a reminder that inflation still has real consequences, even when equity markets are performing well.
Welcome to the Fed Mr. Warsh
After more than eight years in charge of the Fed, Jerome Powell has officially stepped down as chair and Kevin Warsh takes the baton to lead the largest central bank in the world.
Powell navigated COVID, a generational spike in inflation, an extremely aggressive rate hike cycle in 2022, Washington drama, wars, and more in his eight years. Did he get everything right? No, as he did not foresee the jump in inflation in 2022 (who can forget “transitory,” a phrase we seem to be flirting with again), but overall, he has navigated things well and done an admirable job. Other than two months in 2020, the economy avoided a recession, and investors have done well under his leadership. In fact, the Dow gained 97.0% during his tenure, for an annualized return of 8.5%, which ranks eighth out of the 16 Fed Chairs. Fun stat: Janet Yellen was the shortest Fed Chair (height, not tenure), but stocks gained a very impressive 12.9% annualized under her leadership, ranking second only to Eugene Black.
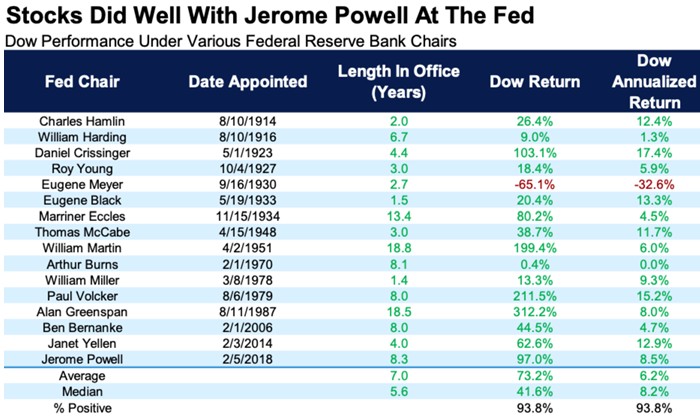
Source: FactSet
Historically, markets have often tested new leadership at the Fed. The most famous example is in 1987, when the market crashed soon after Alan Greenspan took over. There were many other times trouble brewed within six months of new leadership as well, with multiple challenges in in the 1910s and 1930s, and in more recent times after Arthur Burns and then Paul Volcker took over.
In fact, the Dow historically has had an average peak-to-trough decline of -15.2% within the first six months of new Fed leadership. The good news is the past three new Fed chairs saw relatively calm seas, so this is not a sure thing by any means. Of course, with inflation and higher yields, the market very well could test Warsh… stay tuned!
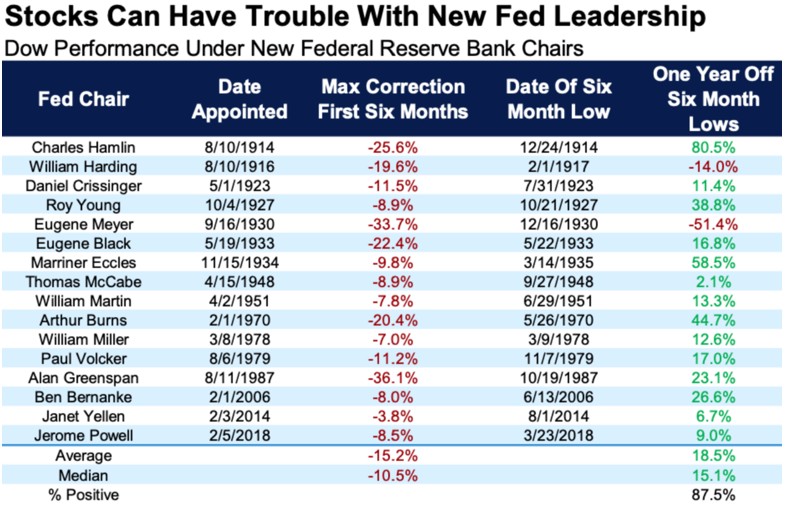
Source: FactSet
What’s Behind the Bond Market Rout?
Looking at the equity market hitting all-time highs, you could be forgiven for thinking all is well. But you do not have to look too far to see where there is pain: the bond market has been struggling. We have been talking about an inflationary growth regime since the start of the year, and equities doing well while bonds struggle is par for the course in this environment. Still, it has been a particularly rough stretch for bond investors (most people are bond investors with at least some of their portfolio).
Treasury yields surged late last week, but this was not a one-day event. Yields have been climbing across the curve since the U.S./Israel-Iran war began and the Strait of Hormuz was closed. From February 27, the eve of the war, through May 18:
- The 2-year Treasury yield rose from 3.37% to 4.12%, an increase of 0.75 percentage points.
- The 10-year Treasury yield rose from 3.94% to 4.56%, an increase of 0.62 percentage points.
These are significant moves, and they have come about in a relatively short period of time.
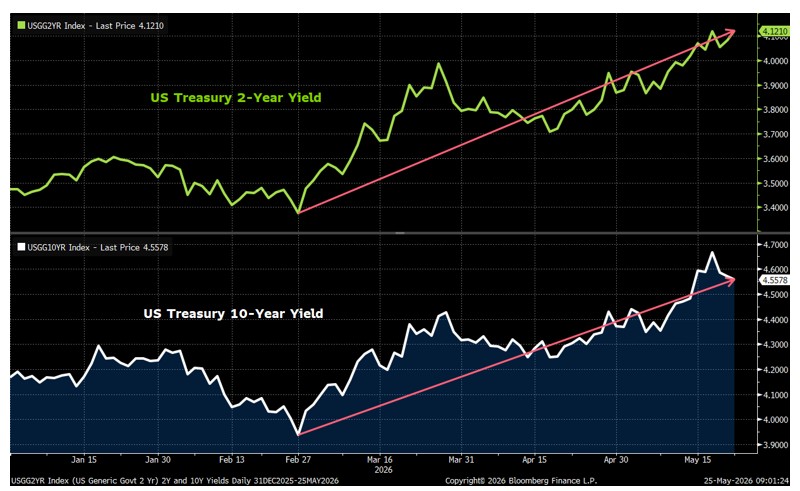
Source: Bloomberg
The Front End of the Yield Curve Says the Fed Is Behind
The 2-year yield at 4.12% means that the market expects the short-term policy rate to average that level over the next two years, well above the current policy rate of 3.63%.
In fact, the probability of a rate hike in 2026 has increased to 70%, making a rate hike this year the base case (just barely, as anything between 30% to 70% is really just a coin toss). Here is a chart showing market expectations for policy rates over the next several years.
- On the eve of the mid-east crisis, markets were expecting a couple more rate cuts this year, taking the policy rate to almost 3%. Markets did expect a series of rate hikes from 2028 onwards, but gradually, with the policy rate exceeding its current level only in 2031.
- The entire curve has now shifted above the current policy rate of 3.63%, implying markets now expect the Fed to hike rates this year and continue lifting them beyond 2026.
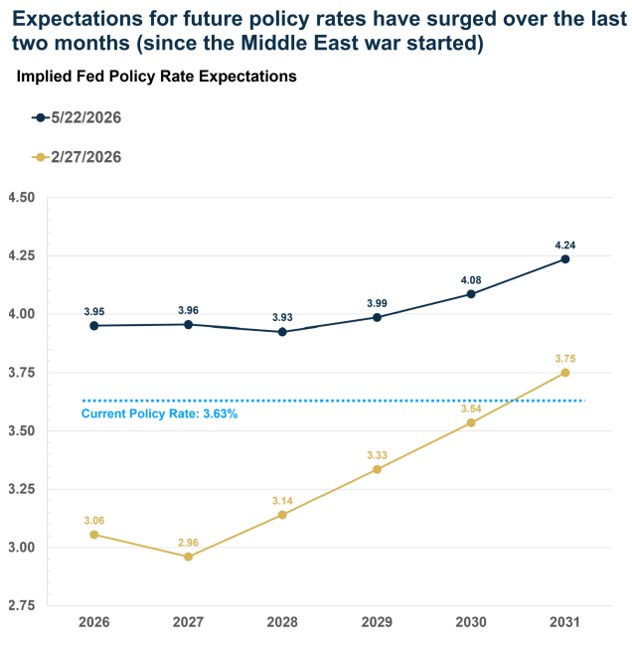
Source: Bloomberg
In other words, market participants expect rates to stay higher for longer as the Fed looks to get a grip on inflation. Hence, it should not be a surprise that even long-term rates are rising. On the other end of the yield curve, the 30-year Treasury yield hit a peak of 5.19%, the highest level in 30 years. It has pulled back to about 4.97% now, but for reference, it was 4.61% on the eve of the war.
Source: Bloomberg
The bond market clearly does not like elevated inflation, which is why yields are rising. But there is also the prospect of falling demand from abroad as yields on non-U.S. government bonds rise and become more attractive.
Closed Strait = Higher Oil Prices = Inflation Problem
The Strait of Hormuz remains shut, and oil prices remain elevated. Higher oil prices mean higher inflation, and higher inflation means higher yields. It really is that simple.
The U.S.-China summit produced no progress on the Middle East front. There was hope that China might pressure Iran to reopen the Strait of Hormuz. That did not happen. China said it wants oil flowing again, but it appears comfortable with Iranian control of the strait, including the possibility of Iran charging ships a toll to pass through. That remains unacceptable to the U.S., at least for now.
While the Middle East stalemate continues, though, there seems to be more positive news over the last few days. Once again, turmoil in the bond market rather than the stock market increases odds of a U.S.-Iran deal. Without a deal, and with each passing day, global oil reserves are being drawn down, including in the U.S., which is drawing oil from its Strategic Petroleum Reserve (SPR) at a record pace. The likelihood of the inflation problem growing even larger increases as a result, which is why bond yields are surging.
Final Thoughts
The key takeaway is that the bond market is absorbing the cost of higher inflation. Equities remain strong because we have inflationary growth (rather than stagflation). Nominal GDP growth is running hot, and that benefits corporate revenues and profits. AI-related capex is another tailwind, though this is also pushing inflation higher and putting even more upward pressure on bond yields. For now, a Fed led by Kevin Warsh looks set to look past this immediate bout of inflation and let things run hot. We will see how long the bond market allows them to remain comfortable with that stance.
For now, we continue to believe the path of least resistance remains higher for equities. Earnings growth remains strong, economic activity is holding up, and the AI investment cycle appears to have plenty of runway ahead. At the same time, we believe diversification remains critical. History has shown that markets can remain optimistic for much longer than expected, but they can also change direction quickly when expectations become too extreme.
It is our aim at Asbury Wealth Partners that you find the market commentary we provide informative and useful. As our success grows mainly through referrals from our clients, we encourage you to share this weekly newsletter with your friends, family, and colleagues. If you are a client, we thank you for your business and your confidence. If you are not yet a client, we encourage you to contact us today and explore how our team may be able to add value to your unique financial situation.
Thank You,
Jeff
~~~~~~~~~~~~~~~~~~~~~~~
Jeffrey S. Markewich
Wealth Advisor
Off – 719-548-8103
Cell - 719-357-7747
Text – 702-493-9678
TF - 888-328-7655
~~~~~~~~~~~~~~~~~~~~~~~
An Introduction to Your Friends & Family
is the Greatest Compliment You Can Give
Jeffrey Markewich is a Registered Representative with, and securities and advisory services offered through LPL Financial, a registered investment advisor, Member FINRA/SIPC.
The information contained in this email message is being transmitted to and is intended for the use of only the individual(s) to whom it is addressed. If the reader
of this message is not the intended recipient, you are hereby advised that any dissemination, distribution or copying of this message is strictly prohibited. If you have received this message in error, please reply and you will be removed.
These views are those of the author, not of the broker-dealer or its affiliates. This material contains an assessment of the market and economic environment at a specific point in time and is not intended to be a forecast of future events, or a guarantee of future results. All investments involve risk, including loss of principal. Forward-looking statements are subject to certain risks and uncertainties. Actual results, performance, or achievements may differ materially from those expressed or implied. Information is based on data gathered from what we believe are reliable sources.
The opinions voiced in this material are for general information only and are not intended to provide specific advice or recommendations for any individual. All performance referenced is historical and is no guarantee of future results. All indices are unmanaged and may not be invested into directly.
The NASDAQ Composite Index measures all NASDAQ domestic and non-U.S. based common stocks listed on The NASDAQ Stock Market. The market value, the last sale price multiplied by total shares outstanding, is calculated throughout the trading day, and is related to the total value of the Index.
S&P 500 – A capitalization-weighted index of 500 stocks designed to measure performance of the broad domestic economy through changes in the aggregate market value of 500 stocks representing all major industries.
The Dow Jones Industrial Average is comprised of 30 stocks that are major factors in their industries and widely held by individuals and institutional investors.
The Russell 2000 Index is an unmanaged index generally representative of the 2,000 smallest companies in the Russell 3000 index, which represents approximately 10% of the total market capitalization of the Russell 3000 Index.
The CBOE Volatility Index? (VIX?) is meant to be forward looking, showing the market's expectation of 30-day volatility in either direction, and is considered by many to be a barometer of investor sentiment and market volatility, commonly referred to as “Investor Fear Gauge”.
International investing involves special risks such as currency fluctuation and political instability and may not be suitable for all investors.
All indexes referenced are unmanaged. The volatility of indexes could be materially different from that of a client’s portfolio. Unmanaged index returns do not reflect fees, expenses, or sales charges. You cannot invest directly in an index. Consult your financial professional before making any investment decision.
There is no guarantee that a diversified portfolio will enhance overall returns or outperform a non-diversified portfolio. Diversification does not protect against market risk.
Asset allocation does not ensure a profit or protect against a loss.
The Consumer Price Indexes (CPI) program produces monthly data on changes in the prices paid by urban consumers for a representative basket of goods and services (Source: U.S. Department of Labor).
The Gross Domestic Product (GDP) is a comprehensive measure of U.S. economic activity. GDP measures the value of the final goods and services produced in the United States (without double counting the intermediate goods and services used up to produce them). Changes in GDP are the most popular indicator of the nation's overall economic health.
Government bonds and Treasury bills are guaranteed by the US government as to the timely payment of principal and interest and, if held to maturity, offer a fixed rate of return and fixed principal value.
LPL Tracking #1117552