Market Insights - 5/26/26
Observations & Insights – May 26, 2026
Hope you had a nice Memorial Day weekend.
Thank you to all who have sacrificed for our country.
Markets Drift Higher
Stocks overcame a shaky start to the week, turning positive on Wednesday as the S&P 500 recorded its eighth weekly gain in a row, the longest streak since late 2023. The Dow outperformed, eclipsing its historic peak set more than three months earlier. At Friday’s close, the S&P 500 and the NASDAQ were slightly below the record levels they set on May 14.
Key Points
- The S&P 500 gained for the eighth week in a row.
- It has been a good year for stocks, but we are not surprised, as an “average” year is unusual.
- After such a historic run, a pause would be perfectly normal, but the strength we have seen so far in May could be a clue that the rest of this year could be strong.
- No matter how you slice it, inflation looks hot, and it is not just energy and tariffs.
- While rising inflation has hurt bonds and raised borrowing costs, it can actually help stocks when accompanied by economic growth and a dovish Fed.
Observations: Bonds Stay Volatile While Earnings Continue to Impress
The recent rise in inflation-driven bond market volatility peaked on Tuesday, when the yield of the 30-year U.S. Treasury closed at 5.18%, the highest since 2007. While yields slipped later in the week, they remained elevated, with the 10-year Treasury ending the trading week at 4.56%, the highest in 12 months.
The outsize impact that mega-cap tech companies are having on the broader market’s earnings became more apparent after the last of the so-called Magnificent Seven stocks reported quarterly results. Those seven firms recorded average first-quarter earnings growth of 63%, versus 17% for the other 493 companies in the S&P 500 Index, according to FactSet. For the Mag 7, it was the highest quarterly growth rate in nearly six years.
The price of U.S. crude climbed above $108 per barrel on Tuesday, only to slip back below $100 as negotiations over the Middle East conflict continued. For the week, oil was down more than 4% at Friday afternoon’s price of around $97.
A monthly gauge of U.S. consumer sentiment fell to a record low, extending its recent decline amid a spike in energy prices. The University of Michigan’s survey results released on Friday showed that sentiment fell to a final May reading of 44.8 from a preliminary figure of 48.2 released a couple of weeks earlier. It was the third straight monthly decline following a recent peak of 56.6 in February.
Minutes released on Wednesday from the U.S. Federal Reserve’s most recent meeting showed that policymakers were considering keeping rates unchanged longer than previously expected while also considering rate hikes if inflation remains high. A majority of Fed members said that a shift to more restrictive monetary policy would likely become appropriate if inflation remains above the Fed’s long-term 2% inflation target.
A U.S. small-cap benchmark outperformed its large-cap peer by a wide margin, extending small caps’ year-to-date outperformance. The small-cap index rose 2.7% for the week versus a 1.1% gain for the large-cap benchmark.
A monthly report scheduled for release on Thursday will provide a fresh look at the recent rise in inflation, including higher energy costs. An earlier reading from the Personal Consumer Expenditures Price Index showed an annual rate of 3.5% in March. A subsequent report on another inflation gauge, the Consumer Price Index, showed an April reading of 3.8%, the highest level in nearly three years.
Insights: Inflation Running Hot & So Are Stocks
The rally continued last week, with the S&P 500 now up eight weeks in a row for the first time since late 2023. Yes, we remain quite optimistic about the remainder of this year, but we also need to be realistic about near-term expectations, as the stock market has had a historic move off the late-March lows. A potential pause or a little weakness here could give the bull market a chance to catch its breath and could actually be a good thing for the big picture.
No Such Thing as An Average Year
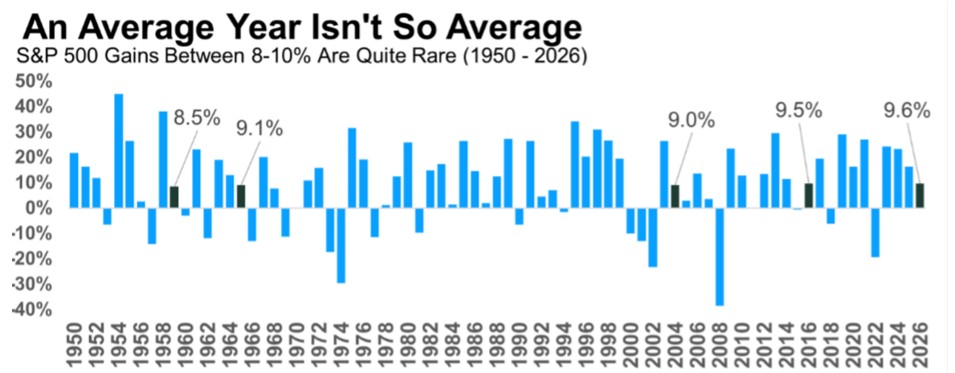
Here is something that is very important to remember: There is no such thing as an average year when it comes to the stock market. Since 1950, the S&P 500 has had an average return of 9.6% but gains near that level in an individual year are rare.
In fact, we found only four times in the past 76 years that saw stocks gain 8% to 10% (or about average). In other words, average is not so average when it comes to investing.
Source: YCharts
Given we are in that 8% to 10% range right now, could we really see stocks finish virtually flat over the next seven-plus months of 2026? We would say probably not. In fact, we think having a current return at that “average” level in May suggests the potential for more upside and movement toward our year-end S&P 500 target range of 12% to 15%.
‘May’-be This Is a Bullish Clue
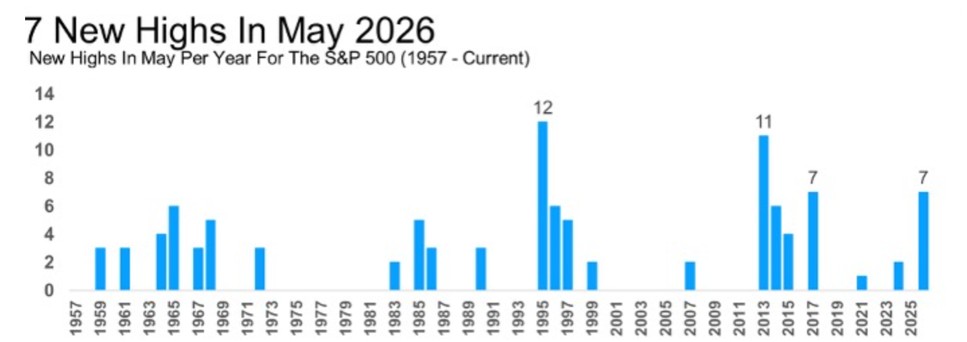
We noted at the start of the month why we expected to see potential strength this May, and that has been happening in a big way. With the month almost over, we have seen an incredible seven all-time highs, the most in May since 2017. In fact, only 1995, 2013, and 2017 saw this many new highs, and that was for the entire month of May. What happened the final seven months those years? Higher at least double digits all three times and up more than 13.2% on average. The May strength could be another clue the bull is alive and well.
Source: FactSet
Inflation Looks Hot No Matter How You Slice It
The inflation data does not look great no matter how you slice it. The headline Consumer Price Index (CPI) rose 0.64% in July (equivalent to an 8% annualized rate), with the three-month annualized pace running at 7.3%. CPI is now up 3.8% over the past year, the highest reading since May 2023.
As we look over inflation numbers, though, keep in mind that inflation is not always bad for stocks, especially if the Federal Reserve is inclined to let the economy “run hot,” which is where we believe we are now. When that is true, higher prices can mean higher revenue (and margins) for businesses, which can be good for stocks. There may be a comeuppance one day if the Fed has to raise rates sharply to get inflation under control (like 2022), but that is not where we are now. Until we get there, we believe that thoughtful investors need to understand the upside of inflation for stocks, even if consumers are seeing the downside every time they make a purchase.
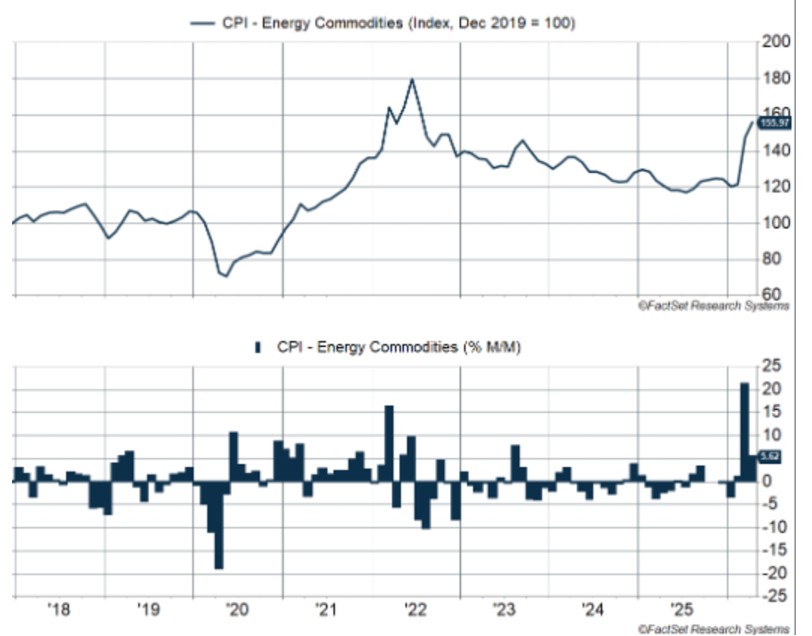
The big inflation driver has been energy prices, with gasoline prices rising over 5% in April, on the back of a 22% increase in March (which was higher than any single month in 2022). Energy commodities (which include gasoline and fuel oil) have now increased more than 28% over the past two months, taking prices to their highest level since July 2022. Back in 2022, prices rose 32% over the first six months of the year. This current spike is larger, and it is happening quickly.
Source: FactSet
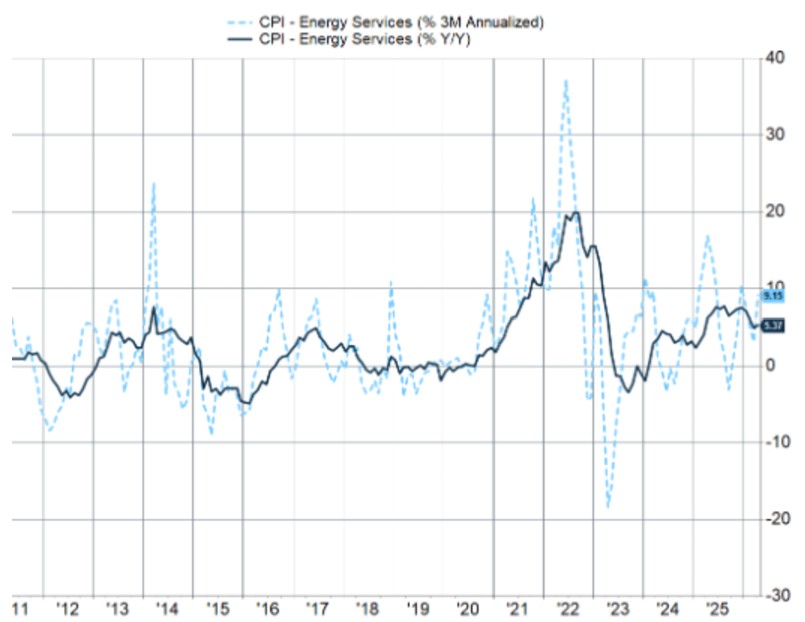
On top of that, energy services inflation (electricity and utilities) is also elevated, rising at a 9.2% annualized pace over the past three months and 5.4% over the past year.
Source: FactSet
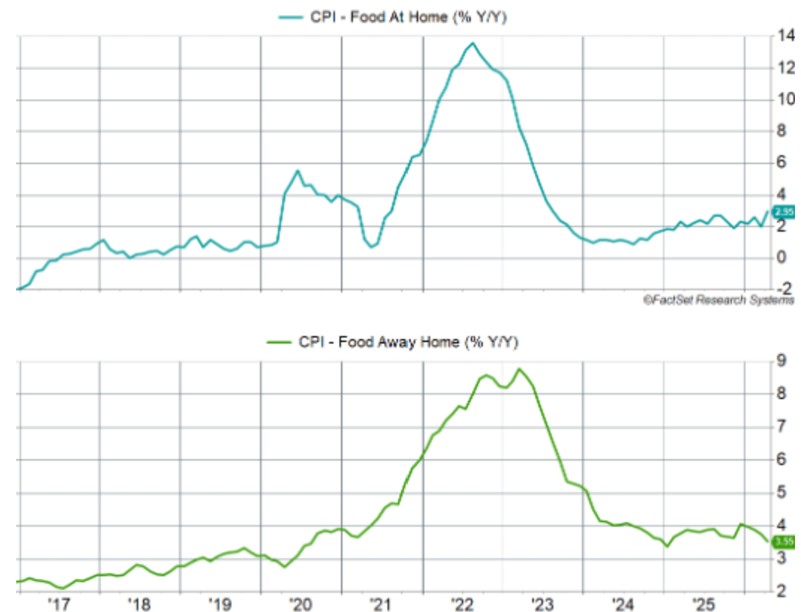
Meanwhile, food prices (both grocery and restaurant prices) are also rising at a hot clip. Before the pandemic (2017-19), grocery inflation (food at home) ran at an average annualized pace of 0.4%, and inflation for food away from home ran at 2.7%. We are well above that now.
Food at home inflation is up 3.9% annualized over the last three months and 3.0% year over year. Inflation’s running especially hot for several popular items:
- Meats: +8.8% year over year (y/y)
- Fresh vegetables: +11.5% (y/y)
- Tomatoes: +39.7% (y/y)
- Lettuce: +7.9% (y/y)
- Coffee: +18.5% (y/y)
Inflation for food away from home is up 3.2% annualized over the last three months, and 3.6% year over year.
Source: FactSet
It is too early for elevated food price inflation to be a direct consequence of the Middle East conflict and higher energy prices. While higher prices for diesel (used for transportation) and fertilizer (a by-product of natural gas) should impact food prices, that is probably further down the road. Of course, that means we could be in store for a more prolonged period of food inflation.
“Core” inflation looks at inflation excluding food and energy, since food and energy are traditionally more volatile. But the reality is that these are everyday items that make up a sizable portion of household budgets. Energy (both commodities and services) and food make up 20% of the CPI basket. Rising inflation for these items puts a real strain on households.
Keep in mind that the Fed targets headline inflation, which includes food and energy (though their preferred metric is the Personal Consumption Expenditures Price Index). They focus on core inflation only to gauge the underlying trend. That trend is not good either.
Core Inflation Also Has a Lot of Problems
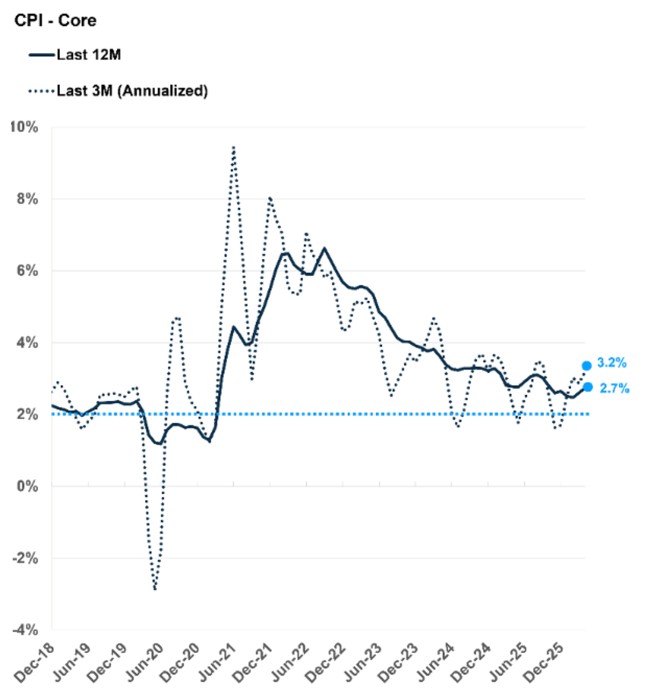
Core CPI rose 0.38% in April, which translates to a 4.6% annualized pace. That is hot, as is the three-month annualized pace of 3.2%. Core CPI is now up 2.7% over the past 12 months. Inflation is elevated and going in the wrong direction.
Source: BLS
Now, a big chunk of core CPI is housing, which makes up about 43% of the basket. This came in on the hotter side in April and reverses some of the softness we saw over the past six months. This is due to a statistical quirk. Missing data in October amid the government shutdown led the Bureau of Labor Statistics to assume there was zero inflation in prices that month. We are catching up to reality now.
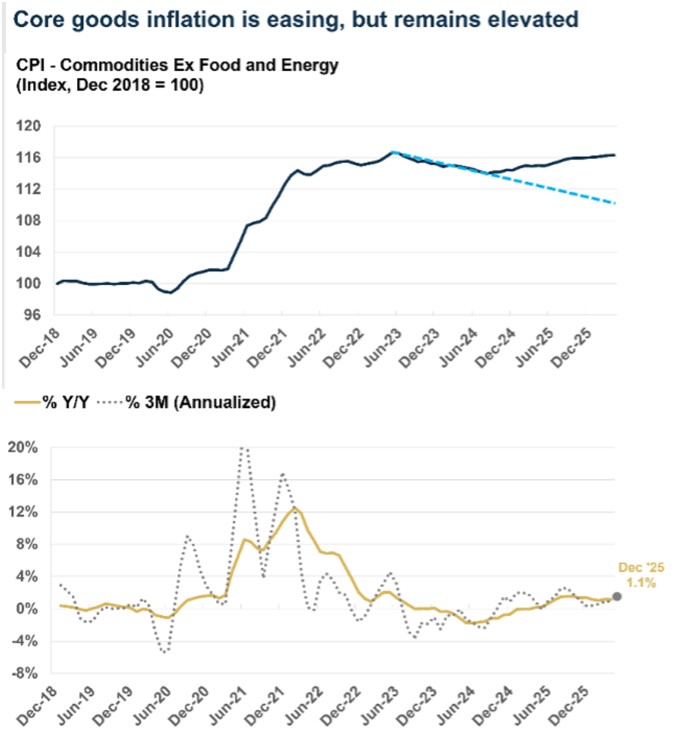
There are some commentators who have said that if you exclude housing, core inflation was “moderate,” but that is not really the case. CPI for commodities excluding food and energy was flat in April, amid fading tariff pressures. Still, the three-month pace is running at 0.9% annualized, and prices are up 1.1% from a year ago. That may not seem like much, but it is hot relative to pre-pandemic (2018-19), when commodities (ex-food and energy) experienced zero inflation.
Source: FRED
At the same time, there are items that are still feeling the impact of tariffs, such as apparel. Apparel prices have risen at an annualized pace of 12% over the past three months and are up 4.2% from last year.
Another category experiencing significant inflation is computer software and accessories, which is seeing the impact of demand from AI. CPI for computer software/accessories is up a whopping 83% annualized over the last three months, which tells you that AI demand is far outrunning supply at this time. This barely impacts core CPI because it is only 0.04% of the basket, but it makes a bigger difference for the Fed’s PCE inflation, where it accounts for about 1% of the basket.
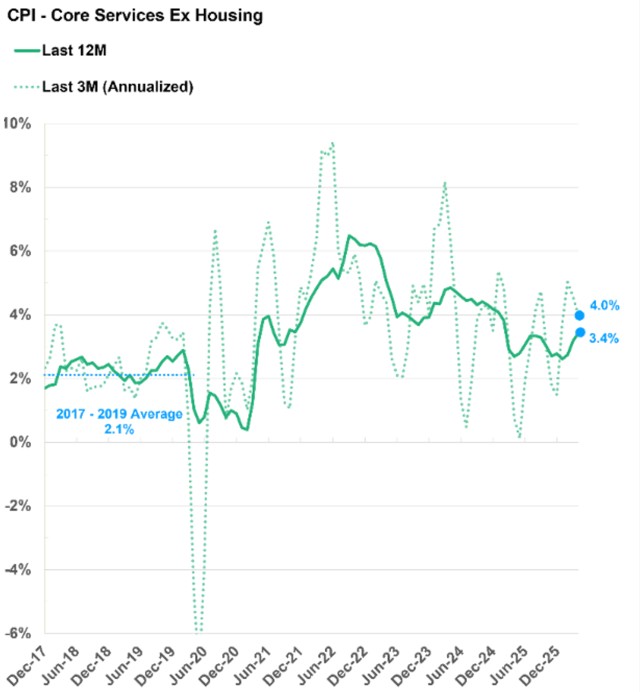
All of that is on the goods side, but inflation is problematic even if you look at core services excluding housing. Prices for this category rose 0.38% in April, equivalent to 4.6% annualized. The three-month annualized pace is 3.2%, and prices are up 2.7% year over year, well above the 2017-19 trend of 2.1%.
Source: Carson, BLS
Here is a summary of some different ways of looking at inflation, including a couple of other measures that try to capture what is going on at the core of inflation. It is clear the problem is broad and not isolated to just energy, or tariffs. Across these measures, the three-month pace is mostly hotter than the 12-month pace, which tells us that momentum is in the wrong direction. In addition, all the readings are above the 2017-19 trend. In short, inflation is elevated and going the wrong way no matter how you slice it.
Source: Carson investment Research
Final Thoughts: Bonds Don’t Like the Inflation Backdrop, but Stocks Do (For Now)
The most direct impact of the inflation backdrop is on the bond market. Short and long-term yields are at the highest levels we have seen this year and reflect the real cost of the Middle East crisis and underlying inflationary heat. US Treasury 2-year and 10-year yields have risen to their highest levels this year even with the equity market reaching all-time highs. (Bond prices fall when yields rise.)
- The 2-year Treasury yield has risen from 3.37% on the eve of the war to 4.13%.
- The 10-year Treasury yield has risen from 3.94% to 4.56%.
As we discussed in our 2026 Outlook, we expected an inflationary growth environment this year, and that is where we are. That environment is not great for bond yields and general borrowing costs, but the labor market is holding up well. With inflation high and rising and a solid job market, normally we would be talking about rate hikes. However, the Federal Reserve under incoming Chair Kevin Warsh is expected to hold rates steady for the rest of the year. That is a potential tailwind for stocks, as is the boost inflation can give to sales growth (even if unit growth grows more slowly) and margins. We can see some of the effect in the aggregate earnings numbers. According to FactSet data, with 91% of S&P 500 companies having reported Q1 results, the blended year-over-year earnings growth rate is 27.7%. If we end the quarter there, it will be the highest growth rate since Q4 2021. Despite inflation, and even partially because of it, stocks have been doing just fine.
It is our aim at Asbury Wealth Partners that you find the market commentary we provide informative and useful. As our success grows mainly through referrals from our clients, we encourage you to share this weekly newsletter with your friends, family, and colleagues. If you are a client, we thank you for your business and your confidence. If you are not yet a client, we encourage you to contact us today and explore how our team may be able to add value to your unique financial situation.
Thank You,
Jeff
~~~~~~~~~~~~~~~~~~~~~~~
Jeffrey S. Markewich
Wealth Advisor
Off – 719-548-8103
Cell - 719-357-7747
Text – 702-493-9678
TF - 888-328-7655
~~~~~~~~~~~~~~~~~~~~~~~
An Introduction to Your Friends & Family
is the Greatest Compliment You Can Give
Jeffrey Markewich is a Registered Representative with, and securities and advisory services offered through LPL Financial, a registered investment advisor, Member FINRA/SIPC.
The information contained in this email message is being transmitted to and is intended for the use of only the individual(s) to whom it is addressed. If the reader
of this message is not the intended recipient, you are hereby advised that any dissemination, distribution or copying of this message is strictly prohibited. If you have received this message in error, please reply and you will be removed.
These views are those of the author, not of the broker-dealer or its affiliates. This material contains an assessment of the market and economic environment at a specific point in time and is not intended to be a forecast of future events, or a guarantee of future results. All investments involve risk, including loss of principal. Forward-looking statements are subject to certain risks and uncertainties. Actual results, performance, or achievements may differ materially from those expressed or implied. Information is based on data gathered from what we believe are reliable sources.
The opinions voiced in this material are for general information only and are not intended to provide specific advice or recommendations for any individual. All performance referenced is historical and is no guarantee of future results. All indices are unmanaged and may not be invested into directly.
The NASDAQ Composite Index measures all NASDAQ domestic and non-U.S. based common stocks listed on The NASDAQ Stock Market. The market value, the last sale price multiplied by total shares outstanding, is calculated throughout the trading day, and is related to the total value of the Index.
S&P 500 – A capitalization-weighted index of 500 stocks designed to measure performance of the broad domestic economy through changes in the aggregate market value of 500 stocks representing all major industries.
The Dow Jones Industrial Average is comprised of 30 stocks that are major factors in their industries and widely held by individuals and institutional investors.
The Russell 2000 Index is an unmanaged index generally representative of the 2,000 smallest companies in the Russell 3000 index, which represents approximately 10% of the total market capitalization of the Russell 3000 Index.
The CBOE Volatility Index? (VIX?) is meant to be forward looking, showing the market's expectation of 30-day volatility in either direction, and is considered by many to be a barometer of investor sentiment and market volatility, commonly referred to as “Investor Fear Gauge”.
International investing involves special risks such as currency fluctuation and political instability and may not be suitable for all investors.
All indexes referenced are unmanaged. The volatility of indexes could be materially different from that of a client’s portfolio. Unmanaged index returns do not reflect fees, expenses, or sales charges. You cannot invest directly in an index. Consult your financial professional before making any investment decision.
There is no guarantee that a diversified portfolio will enhance overall returns or outperform a non-diversified portfolio. Diversification does not protect against market risk.
Asset allocation does not ensure a profit or protect against a loss.
The Consumer Price Indexes (CPI) program produces monthly data on changes in the prices paid by urban consumers for a representative basket of goods and services (Source: U.S. Department of Labor).
The Gross Domestic Product (GDP) is a comprehensive measure of U.S. economic activity. GDP measures the value of the final goods and services produced in the United States (without double counting the intermediate goods and services used up to produce them). Changes in GDP are the most popular indicator of the nation's overall economic health.
Government bonds and Treasury bills are guaranteed by the US government as to the timely payment of principal and interest and, if held to maturity, offer a fixed rate of return and fixed principal value.
LPL Tracking #1114440