


Market Insights 5/18/26
Observations & Insights – May 18, 2026
Thank you to all who attended our 3rd Saturday Cars & Coffee this past weekend. It was a beautiful day with some great people and their cool cars. Next Cars & Coffee will be on Saturday, June 20th, see you there.
Markets Drift Sideways
The S&P 500 eked out its seventh weekly gain in a row, but the index’s barely-there 0.2% rise marked a sharp departure from the big increases seen in the preceding weeks. The NASDAQ and Dow both recorded fractional weekly declines after stocks rallied on Thursday, only to retreat on Friday.
Key Points
- Stocks paused after a massive April rally, with the S&P 500 posting a seventh straight weekly gain while bond yields surged to multi-year highs amid renewed inflation concerns.
- Inflation continues to run hotter than expected, driven not only by energy prices and geopolitics, but also by powerful AI-related demand that is pushing up costs across technology, semiconductors, and materials.
- The AI investment boom remains one of the strongest forces supporting markets, with hyperscale technology companies dramatically increasing capital spending and driving earnings growth higher across multiple sectors.
- Despite rising inflation and higher Treasury yields, the economy and labor market remain resilient, supported by strong nominal growth, fiscal spending, and continued consumer demand.
- We remain constructive on equities in this inflationary growth environment, but continue emphasizing diversification thru shorter-duration bonds, alternatives, and risk management.
Observations: Bond Yields Spike as Inflation Heats Up
A recent bond market sell-off accelerated, as yields of U.S. government bonds rose on Friday to the highest levels in 12 months or more. The 10-year Treasury yield finished the week at 4.59%, up from less than 4.00% as recently as late February. The 2-year yield was 4.08%, while the 30-year was at 5.12%—the highest since 2007.
Bond yields rose on Tuesday after a Consumer Price Index report showed that inflation rose at a 3.8% annual rate in April, the highest level since May 2023. A separate monthly report on wholesale prices showed a 6.0% annual rate for the Producer Price Index, the highest since December 2022.
Recent bond market trading supports expectations of a potential rate hike by year end, marking a reversal from earlier expectations of rate cuts. Friday’s trading in rate futures markets implied a roughly 50% probability that the Fed would lift its benchmark rate by either a quarter-point or a half-point by December, according to CME FedWatch. The probability of rates remaining unchanged was nearly 49%, with less than a 1% probability of a cut.
The nearly completed earnings season has been strong on a revenue basis, not just in terms of profits. As of Friday, companies in the S&P 500 were on pace to record first-quarter revenue growth of 11.4%, the highest rate since the second quarter of 2022, according to FactSet. As for profits, companies were on track Friday for an earnings growth rate of 27.7%, the strongest since 2021’s fourth quarter.
The Senate on Wednesday approved the nomination of Kevin Warsh as chair of the U.S. Federal Reserve. He replaces Jerome Powell, who led the Fed for eight years. Warsh’s first meeting as chair is set for June 16-17, with Powell retaining a seat as a Fed governor for now.
A U.S. large-cap growth index outperformed its value style counterpart for the sixth week out of the past seven, marking a shift from the value style’s run of outperformance earlier this year. At the market capitalization level, small-cap stocks lagged in the latest week, with a small-cap benchmark falling -2.3%.
The U.S. dollar strengthened to a two-week high relative to a basket of other major currencies on Friday, marking its fifth consecutive daily gain. The greenback’s weekly rise was its largest in two months, and came amid growing market expectations of more restrictive U.S. monetary policy ahead.
Insights: Still Riding the Wave
In our annual market Outlook, we wrote about being in an inflationary growth environment and riding the wave of AI-related investment. Here we are six months later, and things have played out almost exactly as that. Of course, we did not predict the Middle East crisis and the energy price shock that followed, but inflation was a growing problem even before then. The AI-wave has only grown in strength, and technology stocks are riding higher on the back of that and pulling the overall market higher.
The biggest potential downside risk when we started the year was the labor market, but it looks like things have turned a corner there. After 10 months of job growth see-sawing between positive and negative reports, we finally got back-to-back months of job growth. Job growth is averaging 76,000 per month this year, a vast improvement from the -7,000 monthly average from May to December 2025. Normally, we would say average payroll growth clocking in under 50,000 is no great shakes, but with population growth running low amidst the immigration collapse, the economy does not need to create a lot of jobs to keep the unemployment rate steady. And the unemployment rate has, in fact, stayed steady at a historically low level of 4.3%. The prime-age (25-54) employment-population ratio has held steady at 80.75, higher than at any point in the 2000s or 2010s expansion. The aggregate layoff rate is also at a historical low, pushing against the narrative about layoffs at prominent large firms.
Source: FactSet
Of course, the problem is inflation, and as a result, inflation-adjusted (real) incomes are not growing. At the same time, nominal consumption rose at an annualized pace of 8% in the first quarter, well ahead of the 2023-2024 trend or even 2018-2019. Yet, real consumption lagged these prior trends.
Nominal consumption is running hot on the back of
- One: tax refunds from last year’s tax bill
- Two: consumers drawing down savings to keep consumption steady
The former point gets to the fact that it is very hard to get a significant economic slowdown when the government is running deficits close to 6% of GDP. The US government is running things hot in a way that is unprecedented this deep into an economic expansion (we are now five years from the last recession in 2020). The second point about falling savings rates is also partly due to the stock market doing as well as it is. If portfolio values are going up, and the risk of job loss is relatively low, there is less urgency to save.
Source: FRED
The dynamic of strong nominal growth is also captured in the U.S. leading economic index (LEI). Even during the worst of the post-Liberation Day downturn (April-May), levels were well above what we would normally associate with a recession, let alone levels we have historically seen in advance of a recession (like in 2000 or 2007), which is partly why we did not call for a recession last year. The LEI has seen a bit of an upswing this year, taking it from slightly below trend to above. This tells us nominal activity is running strong, and that is important because nominal GDP growth is where company revenues and profits come from.
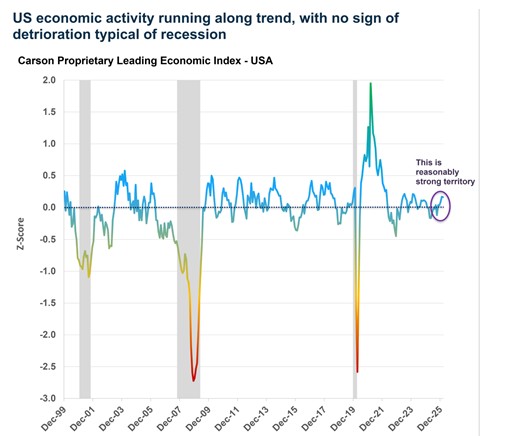
Source: Carson Investment Research
The Big AI Wave Gets Bigger, Driving Profits Higher
We discussed the AI wave in our 2026 Outlook and said we believed the best approach for investors was to ride it, using an equity overweight and broad diversified exposure. Six months later, that picture has not changed, if anything, it has strengthened. AI continues to have a big impact on the economy. When I say “impact,” I am referring to investment spending related to AI, rather than the diffusion of AI through the economy, becoming a big boost to productivity (we have yet to see that and probably won’t until several years from now).
Over the last five quarters (Q1 2025 – Q1 2026), real GDP growth averaged 2.0% annualized. Real investment spending on IT equipment and software has added an average of 0.90%-points per quarter. That is about 45% of real GDP growth, from a part of the economy that makes up under 5% of GDP. This is well above what we saw in the late 1990s, let alone the 2000s. So why is not real GDP growth higher? One issue is that a lot of the AI-related equipment is imported, and so does not directly “contribute” to GDP in a strict sense, since only goods produced domestically contribute to GDP. But that does not mean activity is not running hot.
Source: FRED
Looking ahead, AI-related capex spending is set to keep running hot. The big tech firms, especially those that provide large-scale cloud capacity and operate hyperscale-level data centers (Microsoft, Alphabet, Amazon, Meta, Oracle), are ramping up capex to even larger levels. At the end of last year, these firms were estimated to spend a total of $515B on capex in 2026, up from almost $400B in 2025. That amounts to about 1.6% of GDP, which is staggering. The most recent updates take the 2026 capex estimate to a whopping $740B, which is about 2.3% of GDP (2027 is expected to be even larger at 2.7%), that is over 4x the level of capex in 2023 (0.5% of GDP) and 7x the size of where it was in 2019 (0.3%).
Source: Bloomberg
The melt-up in technology stocks has raised the obvious “bubble” concerns, but notably, this has come on the back of rising profit growth expectations. What’s important to keep in mind here is that one company’s spending is another company’s revenue and profits. That’s the connection between all this spending and what you see in the stock market. Interestingly, these profit growth estimates have seen the largest gains during earnings season, as companies tell us they’re going to spend even more on AI-related capex, and the companies on the other side of that (like the chip companies) see profits rise even more than expected.
The S&P 500’s 2026 EPS expectation has risen over 7% since the start of the year, from $308 to $331. This is not “pulling forward” from 2027, as 2027 EPS expectations have jumped 7% as well, from $355 to $380. A breakdown of the 11 S&P 500 sectors shows exactly which sectors are boosting the aggregate index’s profit (EPS) expectations. From the start of the year, three sectors have mostly contributed to higher profit estimates:
- The tech sector has seen 2026 EPS expectations grow by 14% and 2027 EPS grow by 19%.
- Energy has seen 2026 EPS expectations grow by 48% and 2027 EPS by 19%.
- Materials has seen 2026 EPS expectations grow by 15% and 2027 EPS by 11%
Source: FactSet
The AI-wave is not just isolated to the US either. The MSCI Emerging Markets Index is up 23% year-to-date versus 10% for the S&P 500. This is on the back of massive gains in Korea (MSCI South Korea Index: +103%) and Taiwan (MSCI Taiwan Index: +49%) – both benefiting from large weights for chipmakers.
Inflation is Running Hot, and It is A Broad Problem
Of course, profit growth and margin expansion also translate to inflation. The three sectors that have seen profit growth estimates soar are technology, energy, and materials, which are on the other side of inflation related to AI-bottlenecks and the energy spike due to the Middle East war. This is not to say it is all “predatory pricing.” A lot of these firms are in the right place at the right time, whether it is chip manufacturers (in the US or even in South Korea and Taiwan) or energy companies. As John Maynard Keynes said: “Profiteers are a consequence, not a cause of rising prices.”
Amid AI-related bottlenecks, the Personal Consumption Expenditures Price Index (PCE) for computer software and accessories rose at an annualized pace of 59% in Q1 and 12% over the past year. Prices for this category fell continuously over the past two decades, but we are seeing prices surge higher amid the AI boom. The producer price index (PPI) for semiconductor manufacturing is up 26% year-over-year, while the PPI for printed circuit board manufacturing is up a whopping 160%.
Source: FRED
This is where the current AI wave is not quite like the late-1990s, yet. AI-related inflation shows that demand is outstripping supply now, whereas in the late 1990s, prices for all this stuff were plunging. If it were a bubble, we’d probably see massive over-capacity and over-supply (and then return on investment plunges). We’re not there yet, and perhaps keeping an eye on AI-related bottlenecks is important – if these start to ease, perhaps that will be the sign that we’re moving to oversupply.
The AI-related inflation story underlines why the inflation story is not just about energy or tariffs. Of course, the Middle East war and Strait of Hormuz closure are not helping matters, with the Fed’s preferred inflation metric, the personal consumption expenditures (PCE) index, up 3.8% year-over-year as of April. Core PCE is up 3.3%, but the problem is not isolated to a few items. Setting aside goods for a moment, and even shelter (which has normalized), the PCE index for core services ex-housing is up 3.6% over the past year, well above the 2018-2019 trend of 2.2%. Inflation’s hot, period.
The Fed focuses on PCE rather than CPI, and one of the reasons is that it has a lot more items in the basket. We looked at 178 items within the core PCE basket and calculated the distribution of year-over-year inflation at four different times. You can see how inflation really broadened out in June 2022 relative to December 2019. Up until last year, the distribution was narrowing, but things were still not quite “normal”. And over the past year, things have gotten even worse. Here’s a look at the proportion of items with over 3% inflation rates (with over 4% in parentheses):
- December 2019: 24% with 3%+ inflation (10% with 4%+ inflation)
- June 2022: 72% (58%)
- March 2025: 41% (29%)
- March 2026 57% (42%)
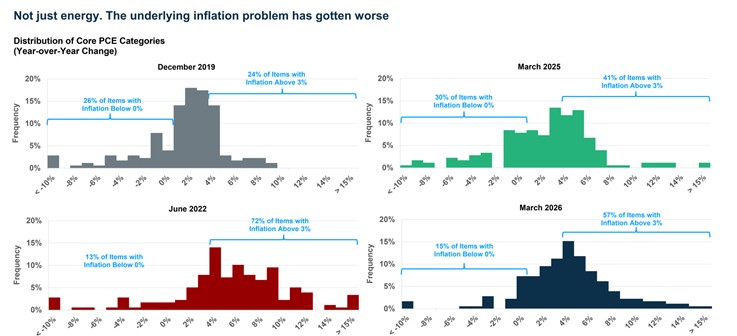
Source: Carson, BLS
Looking ahead, the indirect impact of Strait closure will feed into core inflation as well, via items like airfares and transportation costs (for goods). Food price inflation is likely to stay elevated amid higher fertilizer costs (a lot of which comes from the Middle East as a by-product of natural gas), and that’ll push restaurant prices higher. All this to say, the inflation problem will likely get worse before it gets better.
A Policy Tailwind (For Now): A Fed Expected to “Look Through” Inflation
All said and done, we were a long way away from normal on the inflation front, even if you ignore the energy shock (which you shouldn’t because that’s going to feed into core inflation as we noted above). Normally, a backdrop of a relatively healthy labor market and elevated (and rising) inflation would have the Fed thinking about rate hikes. Instead, it looks like the Fed, especially under incoming Chair Kevin Warsh, is going to look past elevated inflation.
The risk here is quite obvious. At some point, whether it’s a year from now or 2-3 years from now, the Fed will realize that inflation has run too high for too long and will have to be even more aggressive to get inflation back to target. The current episode could end up being similar to what we saw in the 1970s and into the early 1980s. A relatively easy Fed looked past elevated inflation, but then Fed Chair Paul Volcker came in and raised rates to over 15% to ultimately crush inflation, in the process sending the economy into a big recession. That doesn’t imply we’ll see interest rates rise to 10% or more, like in the 1980s, but even raising rates to 5-6% from this point will be quite painful.
The 1970s and 2020s inflation episodes are shown in the chart below (using headline PCE inflation), along with the three-month Treasury yield (using this as a proxy for policy rates). As you can see in the bottom panel, the gap between rates (green dashed line) and inflation (dark blue line) has closed. In other words, the fact that the Fed is standing pat while inflation remains elevated (and is rising) means policy is getting more dovish even if rates stay where they are.
Source: Carson investment Research
Welcome to The Party, Mr. Warsh
For now, the ultimate beneficiary of a dovish Fed that is willing to let inflation run hot is the stock market (and investors). At the same time, the real cost of higher inflation, and arguably the war in the Middle East, is reflected in the bond market. Short and long-term yields are at the highest levels we have seen this year and reflect the real cost of the crisis. Since the eve of the war (February 27th):
- 2-year treasury yields have risen 70 bps to 4.07 – well above the current Fed policy rate of 3.63, implying markets think the Fed will ultimately have to raise rates
- 10-year treasury yields have risen 63 bps to 4.57
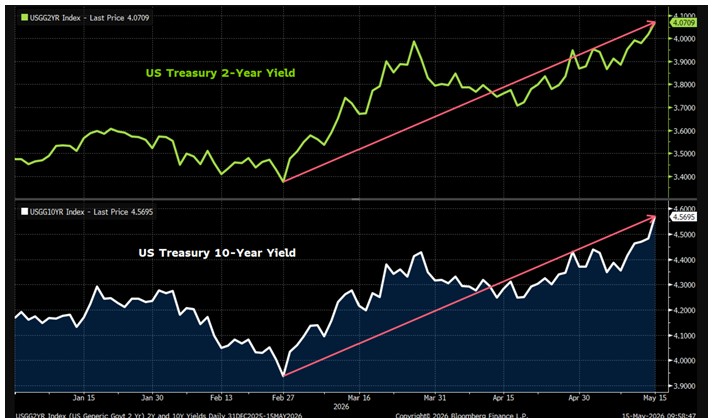
Source: Bloomberg
The 30-year treasury yield is now at 5.11, the highest level we’ve seen in recent years.
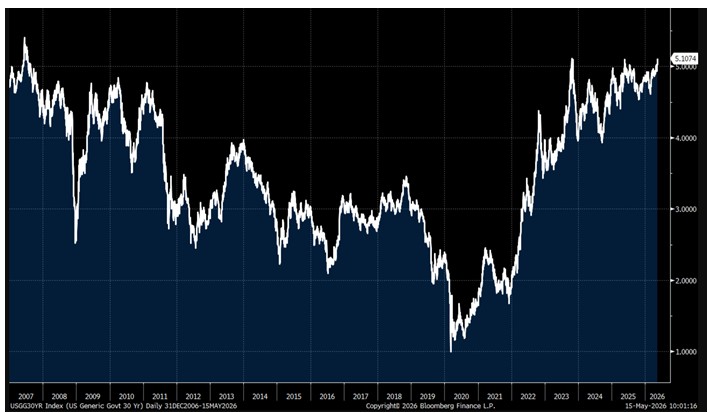
Source: Bloomberg
War is expensive, and in this case, we are going to have to live with higher borrowing costs (including the government). That is going to drag on areas of the economy like housing. For now, the AI wave is powerful enough to overcome that, but therein also lies risk and it can hurt once the party ends.
The inflation backdrop and the bond market are giving Kevin Warsh a real test as he begins his tenure. We wish him the best of luck, for all our sakes. He is going to need it!
Final Thoughts: We Are Still Riding the Wave, But Looking to Avoid a Wipeout
For our part, we remain overweight equities amid this inflationary growth environment; we have a massive capex boom, fiscal expansion, and easy monetary policy for now. While there are several risks out there; the Fed reversing to a very hawkish position and a reversal of the AI spending wave, there is also a right tail risk, i.e., missing out on a boom that could last a while. But we do not want to be overexposed to the boom and go all in. Which is why we remain diversified across different sectors of the economy and stock markets.
Inflationary growth also means bonds are unlikely to diversify portfolios as well as they did in the 2010s and 2020s. This is why we continue to keep our bond duration short and hold healthy allocations to alternative investment strategies and even cash (rather than long-term bonds).
It is our aim at Asbury Wealth Partners that you find the market commentary we provide informative and useful. As our success grows mainly through referrals from our clients, we encourage you to share this weekly newsletter with your friends, family, and colleagues. If you are a client, we thank you for your business and your confidence. If you are not yet a client, we encourage you to contact us today and explore how our team may be able to add value to your unique financial situation.
Thank You,
Jeff
~~~~~~~~~~~~~~~~~~~~~~~
Jeffrey S. Markewich
Wealth Advisor
Off – 719-548-8103
Cell - 719-357-7747
Text – 702-493-9678
TF - 888-328-7655
~~~~~~~~~~~~~~~~~~~~~~~
An Introduction to Your Friends & Family
is the Greatest Compliment You Can Give
Jeffrey Markewich is a Registered Representative with, and securities and advisory services offered through LPL Financial, a registered investment advisor, Member FINRA/SIPC.
The information contained in this email message is being transmitted to and is intended for the use of only the individual(s) to whom it is addressed. If the reader
of this message is not the intended recipient, you are hereby advised that any dissemination, distribution or copying of this message is strictly prohibited. If you have received this message in error, please reply and you will be removed.
These views are those of the author, not of the broker-dealer or its affiliates. This material contains an assessment of the market and economic environment at a specific point in time and is not intended to be a forecast of future events, or a guarantee of future results. All investments involve risk, including loss of principal. Forward-looking statements are subject to certain risks and uncertainties. Actual results, performance, or achievements may differ materially from those expressed or implied. Information is based on data gathered from what we believe are reliable sources.
The opinions voiced in this material are for general information only and are not intended to provide specific advice or recommendations for any individual. All performance referenced is historical and is no guarantee of future results. All indices are unmanaged and may not be invested into directly.
The NASDAQ Composite Index measures all NASDAQ domestic and non-U.S. based common stocks listed on The NASDAQ Stock Market. The market value, the last sale price multiplied by total shares outstanding, is calculated throughout the trading day, and is related to the total value of the Index.
S&P 500 – A capitalization-weighted index of 500 stocks designed to measure performance of the broad domestic economy through changes in the aggregate market value of 500 stocks representing all major industries.
The Dow Jones Industrial Average is comprised of 30 stocks that are major factors in their industries and widely held by individuals and institutional investors.
The Russell 2000 Index is an unmanaged index generally representative of the 2,000 smallest companies in the Russell 3000 index, which represents approximately 10% of the total market capitalization of the Russell 3000 Index.
The CBOE Volatility Index? (VIX?) is meant to be forward looking, showing the market's expectation of 30-day volatility in either direction, and is considered by many to be a barometer of investor sentiment and market volatility, commonly referred to as “Investor Fear Gauge”.
International investing involves special risks such as currency fluctuation and political instability and may not be suitable for all investors.
All indexes referenced are unmanaged. The volatility of indexes could be materially different from that of a client’s portfolio. Unmanaged index returns do not reflect fees, expenses, or sales charges. You cannot invest directly in an index. Consult your financial professional before making any investment decision.
There is no guarantee that a diversified portfolio will enhance overall returns or outperform a non-diversified portfolio. Diversification does not protect against market risk.
Asset allocation does not ensure a profit or protect against a loss.
The Consumer Price Indexes (CPI) program produces monthly data on changes in the prices paid by urban consumers for a representative basket of goods and services (Source: U.S. Department of Labor).
The Gross Domestic Product (GDP) is a comprehensive measure of U.S. economic activity. GDP measures the value of the final goods and services produced in the United States (without double counting the intermediate goods and services used up to produce them). Changes in GDP are the most popular indicator of the nation's overall economic health.
Government bonds and Treasury bills are guaranteed by the US government as to the timely payment of principal and interest and, if held to maturity, offer a fixed rate of return and fixed principal value.
LPL Tracking # 1111005