

Market Insights 5/11/26
Observations & Insights – May 11, 2026
3rd Saturday Cars & Coffee is this week, 5/16/26 (attached)
10am to Noon, Our N. Parking Lot… weather permitting!
The Rally Continues
The S&P 500 and the NASDAQ recorded their sixth consecutive weekly gains as stronger-than-expected quarterly earnings growth lifted both indexes to fresh record highs. The NASDAQ finished up 4.5% for the week and the S&P 500 added 2.4%. The Dow lagged, posting a fractional gain.
Key Points
- April was an amazing month, with the S&P 500 gaining more than 10%.
- Big monthly gains tend to lead to better performance going forward.
- The six-month stretch that helped give us the saying “Sell in May and Go Away” is here, as historically the worst six consecutive months of the year on average start in May.
- “Sell in May” has not worked recently, and we do not think it will work this year, either.
- The wave of spending on AI infrastructure continues to build.
- Q1 2026 GDP was tepid (although better than Q4 2025), but AI-related demand is strong.
Observations: Earnings Shine as Employment Stabilizes
Profits continued to improve as earnings season entered its final stretch, with analysts now expecting the strongest growth rate since the fourth quarter of 2021, when the economy was recovering from COVID lockdowns. First-quarter net income is expected to rise an average of 27.7% for companies in the S&P 500, based on reports already released as of Friday and forecasts for the relatively small number of firms that had not yet reported, according to FactSet. At the end of March, the projected earnings growth rate was just 13.1%.
The U.S. economy recorded back-to-back monthly jobs gains after alternating between gains and losses each of the previous 10 months. On Friday, the government reported a higher-than-expected gain of 115,000 jobs in April on the heels of March’s upwardly revised figure of 185,000. April’s unemployment rate stayed unchanged at 4.3%.
A U.S. large-cap growth index outperformed its value style counterpart by a wide margin for the fifth week out of the past six, eroding the value style’s still-sizable year-to-date performance lead over growth. As of Friday’s close, the growth benchmark was up nearly 20% over the past six weeks versus an 11% rise for the value benchmark.
Shifting narratives about conflict in the Middle East continued to buffet the oil market, with the price of U.S. crude briefly climbing to $107 per barrel on Monday before sinking to $89 on Wednesday. By Friday afternoon, oil was trading around $95, down around -5% for the week.
The latest surge in oil prices on Monday raised fresh concerns about inflation, and the yield of the 30-year U.S. Treasury eclipsed the 5% threshold for the first time in nearly 10 months. However, the rise was brief, and 10-year and 30-year Treasury yields were down slightly for the week, finishing at 4.37% and 4.95%, respectively.
Predictably, a monthly gauge of U.S. consumer sentiment extended its recent decline amid a spike in energy prices. The University of Michigan’s survey results showed that sentiment fell to a preliminary May reading of 48.2, down from April’s final 49.8 figure. Both numbers are well below a recent peak of 56.6 reached in February.
A Consumer Price Index report scheduled for release on Tuesday will show whether a recent spike in inflation extended into April amid higher energy prices.
As we kick off a new week, the contrast in economic data is much narrower than what we had to navigate previously. Retail sales might generate a little movement, but outside of Tuesday’s Consumer Price Index report, there really is not much coming in that should change the tone for markets. The most recent CPI report showed an annual inflation rate of 3.3% in March, up from the previous month’s 2.4% reading. In March, the energy price component of CPI surged 12.5% on a year-over-year basis. The biggest impact this week will almost certainly come from headlines tied to the Xi Jinping and Trump meeting in China. This is the first time a sitting US president has been to China in over a decade, so it is meaningful regardless of what comes out of it.
Insights: Stay In May?
The incredible rally continued last week, with more gains across the board and more new highs. This is on top of a more than 10% rally in April for the S&P 500, the second-best April ever (going back to 1950). As we noted at the beginning of the month, we expected a rally, but even we certainly did not see a rally of this magnitude coming.
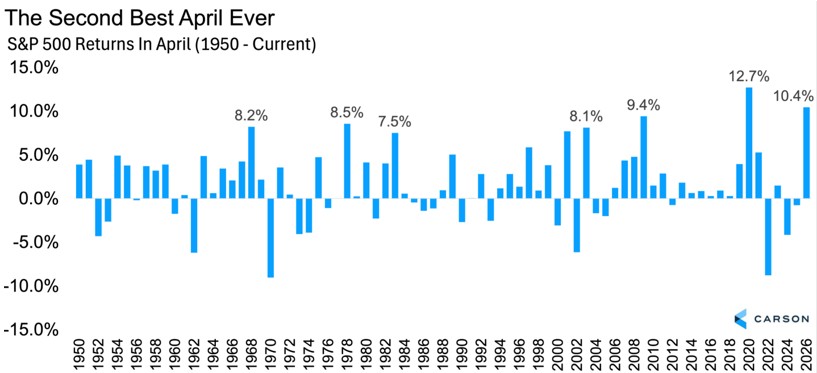
Source: FactSet
Markets Change… and Quickly!
Five weeks ago, in a close repeat of 2025, worries were building that we were heading for a bear market. We pushed back against this narrative and noted many reasons to expect a rally. Well, stocks are now back to new highs, and we do not think the rally is done yet.
There were 13 other times in history that the S&P 500 gained more than 10% in a month, and more often than not, better-than-average returns afterward were common. Yes, 1987 is in there, but up more than 10% six months later on average could bode well for a surprise summer rally.
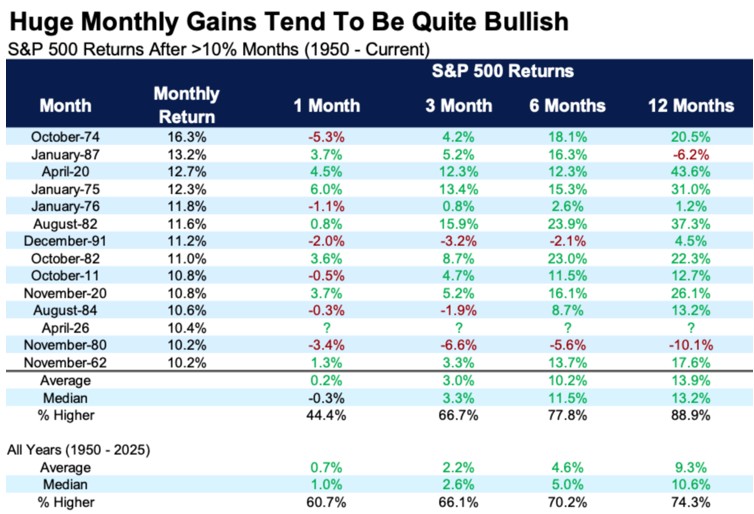
Source: FactSet
‘Sell in May’ Is Here
Buckle up, as the trigger points for one of the most well-known investment axioms, “Sell in May and Go Away,” has arrived. This gets a ton of play in the media, as the six months starting in May are indeed the worst consecutive six months on the calendar historically. The S&P 500 has averaged only 2.1% over those six months and moved higher only 66% of the time.
Source: FactSet
Let’s be clear: Up 2.1% might not sound like much, but it is still an increase. Also, we do not advocate making investing decisions based simply on the calendar, but it is worth being aware of this calendar effect, as you will hear a lot about it from the financial press over the coming weeks.
It Hasn’t Worked Lately
This time a year ago, many were expecting the big rally in April to roll right back over and potentially turn into a bear market. Well, instead we saw the strongest “Sell in May” six-month rally in history. In fact, make that nine of the past 10 years stocks gained during this historically bearish period.
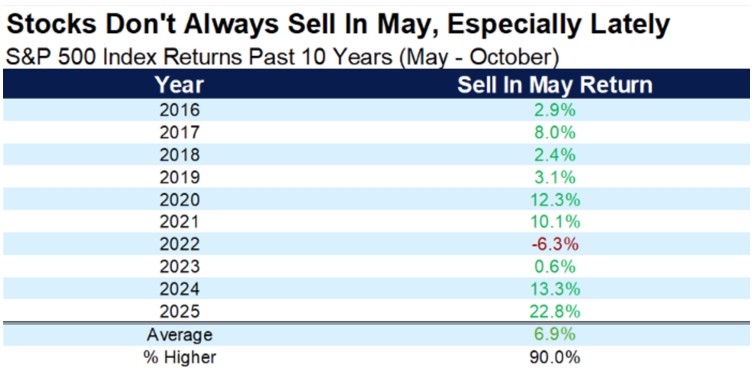
Source: FactSet
Taking this a step further, May, June, and July have been extremely strong lately. Think about these stats:
- The S&P 500 in May has been higher 12 of the past 13 years.
- The S&P 500 in June has been higher nine of the past 10 years.
- The S&P 500 in July has been higher 11 years in a row.
It’s How You Start that Matters
It is worth noting that if the year is positive going into these six months, the market does much better. And if the S&P 500 is up more than 4% for the year (like this year), the next six months go from an average return of 2.1% to 4.4%. The flipside is that some of the worst “Sell in May” periods in history took place after a bad start to the year.
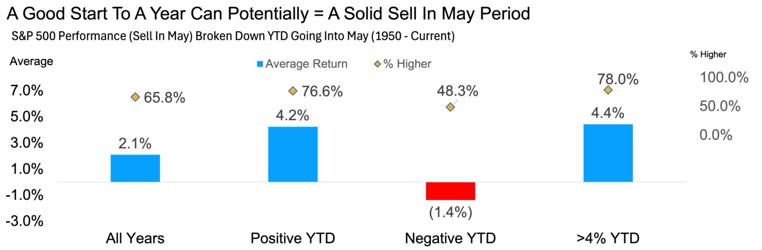
Source: FactSet
The bottom line is that this bull market is alive and well, and we think it may continue for at least the rest of 2026, and possibly much longer and much higher than most market participants think possible.
The AI Wave Continues, and It’s a Big One
In our 2026 Outlook, we said we thought the artificial intelligence (AI) spending wave would be a strong one. Five months later, that picture has not changed, if anything, it has strengthened. AI continues to have a huge impact on the economy, but the focus is still spending related to building out AI rather than AI providing a boost to productivity. That is something we have yet to see, and we probably will not know how AI effects the economy for several years.
AI-related investment is surging on both the hardware and software side. Looking at hardware, investment spending on IT equipment rose at an annualized pace of 43% in Q1 and clocked in at a 31% annualized pace over the past five quarters. The 2010-24 annual pace was just 6%.
Source: Carson, BEA
These numbers are simply massive, and keep in mind that these are all adjusted for inflation. They have made a huge contribution to GDP growth recently. Across the past five quarters, real GDP growth averaged 2%. AI-related hardware (IT equipment) and software spending contributed 0.90 percentage points (pp) per quarter, or about 45%(!) of real GDP growth. (For perspective, consumption contributed an average of 1.36 pp per quarter, but consumption makes up 68% of the economy while AI-related investment spending makes up just under 5% of GDP.) Putting it in historical perspective, from 2001-24, IT equipment and software spending contributed on average 0.27 pp per quarter. Even during the internet boom (1995-2000), it only contributed an average of 0.68 pp per quarter to real GDP growth.
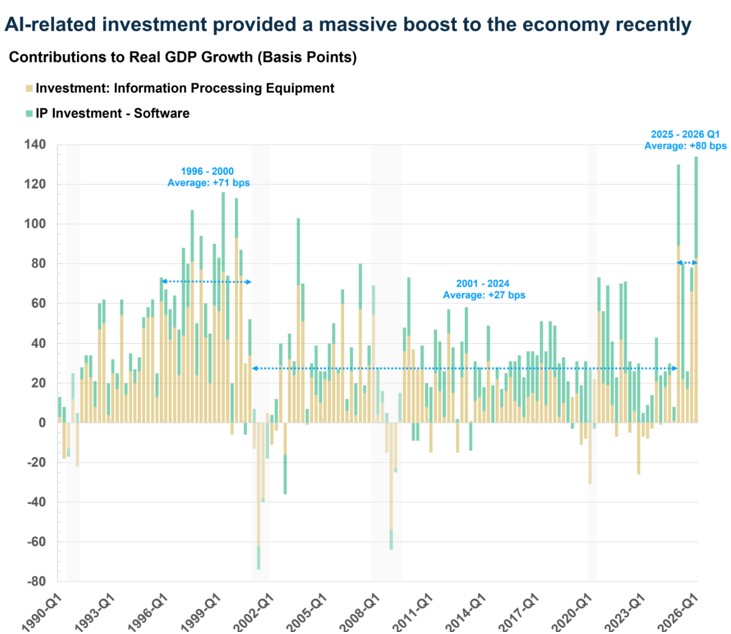
Source: FRED
Looking ahead, it does not seem like there is going to be any let-up, at least in the near term. The big tech firms recently reported earnings, and they are ramping up CAPEX to even higher levels. When we wrote our Outlook for 2026, we estimated that these firms would spend a total of $515 billion on capex in 2026, up from almost $400 billion in 2025. That amounts to about 1.6% of GDP, which is staggering.
The most recent updates take the 2026 capex estimate to a whopping $725 billion, which is about 2.3% of GDP. That is over 4x the level of capex in 2023 (0.5% of GDP) and 7x the size of where it was in 2019 (0.3%). And the wave is still building, 2027 is expected to be even higher.
What is important to keep in mind here is that one company’s spending is another company’s revenue and profits. That is the connection between all this spending and what we are seeing in the stock market.
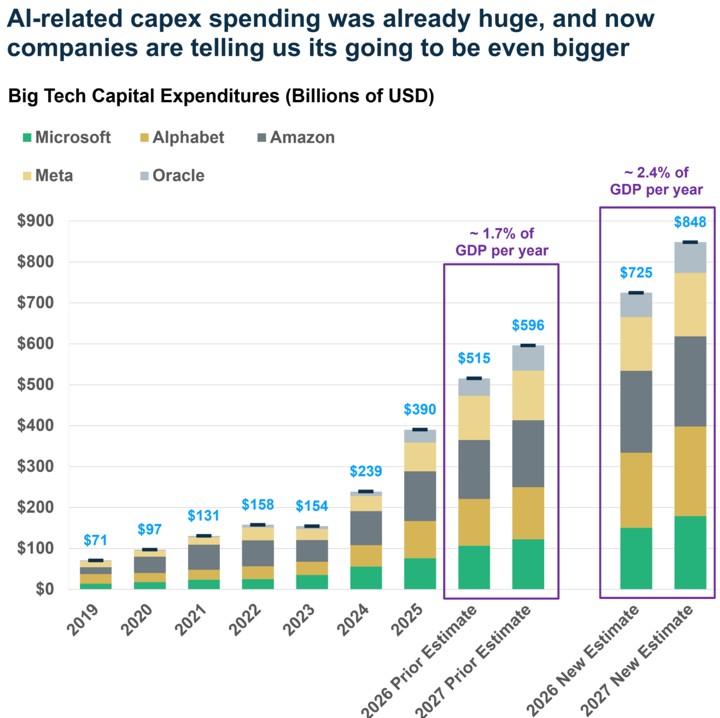
Source: Bloomberg
But Why Is Real GDP Growth Relatively Weak?
Real GDP grew just 2% annualized in Q1, below expectations for a 2.3% increase. This was a pickup from the weak Q4 pace of just 0.5%, but in line with the 2025 pace of 2%. The big bounce from Q4 2025 to Q1 2026 was not a surprise, as weakness from the government shutdown in Q4 reversed and boosted growth in Q1. One way to look past the shutdown impact is to average real GDP growth across the last two quarters. That gets you to a relatively weak 1.25%. That is a marked slowdown from the 2023-24 pace of 2.9% and also below the 2010-2019 trend of 2.4% annualized.
This seems strange given the AI-related investment boom, but the issue is that a lot of the equipment is imported (and also exempted from the post-Liberation Day tariffs), and so it does not directly “contribute” to GDP in a strict sense, since only goods produced domestically contribute to GDP. The way GDP is calculated, the spending appears as part of investment but then gets canceled out by the adjustment for trade.
GDP growth can also be noisy because trade (“net exports,” or exports minus imports) and inventories are volatile. Excluding these gives us “real final demand,” a picture of domestic activity that combines household consumption, investment, and government spending.
Real demand rose at a robust annualized pace of 2.8% in Q1 thanks to the rebound in government spending. If we just focus on the private sector, real demand rose at a relatively healthy pace of 2.5%, and it has averaged 2.4% annualized over the last five quarters. That is not bad, but it is slower than the 3.2% pace we saw across 2023-24 or the 3.0% trend from 2010-19.
Real final demand running below trend is essentially why GDP growth over the last five quarters has clocked in below trend, too. There are two big drivers here:
- Weak goods spending, which has run at an annualized pace of just 1.1%, well below the 2010-19 trend of 3.6% and the 2023-24 pace of 3.9%.
- Weak residential investment (housing), which has fallen at an annualized pace of almost 5% over the last five quarters, versus 4.6% across 2010-19 and 1.9% in 2023-24.
Goods spending can be volatile, especially as consumers pull back amid higher inflation. But housing is paying the biggest cost of higher inflation because of higher interest rates. Residential investment has now fallen in seven of the last eight quarters, and this weakness is likely to continue if interest rates remain on the high side.
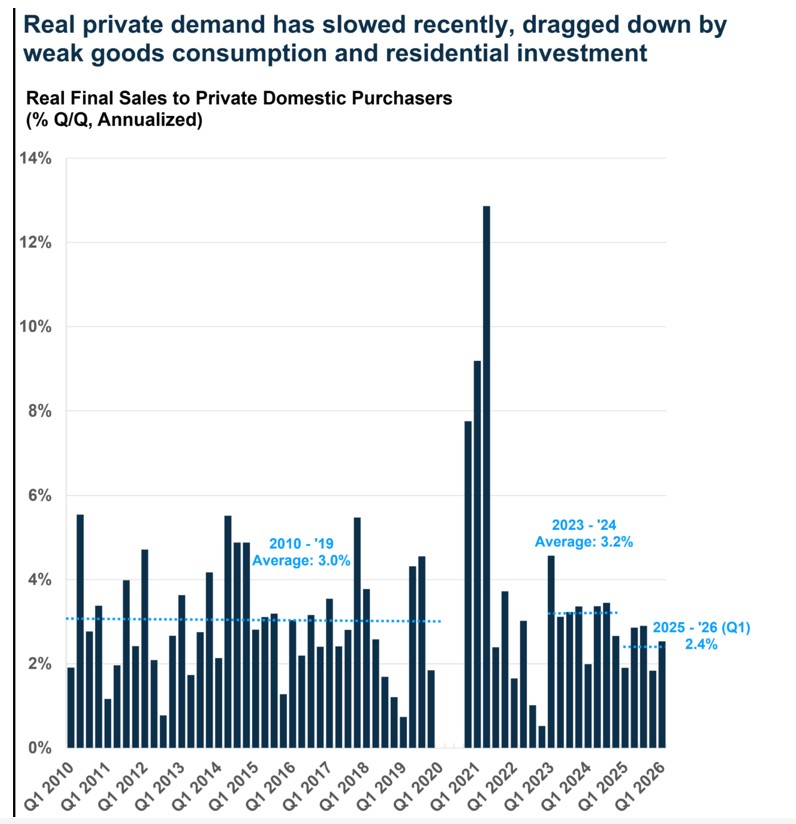
Source: BEA
AI Feeding Through to Inflation
Despite the war with Iran and resulting energy crisis, arguably the most important macro story right now is the AI wave. But while AI demand continues to increase, supply can barely keep up, which is why we are seeing massive AI-related investment that is more than offsetting weakness in other parts of the economy (like housing). However, the other side of this mismatch of supply and demand is inflation.
Amid AI-related bottlenecks, the Personal Consumption Expenditures Price Index (PCE) for computer software and accessories rose at an annualized pace of 59% in Q1. Prices for this category fell continuously over the past decade, but we are seeing prices surge higher amid the AI boom.
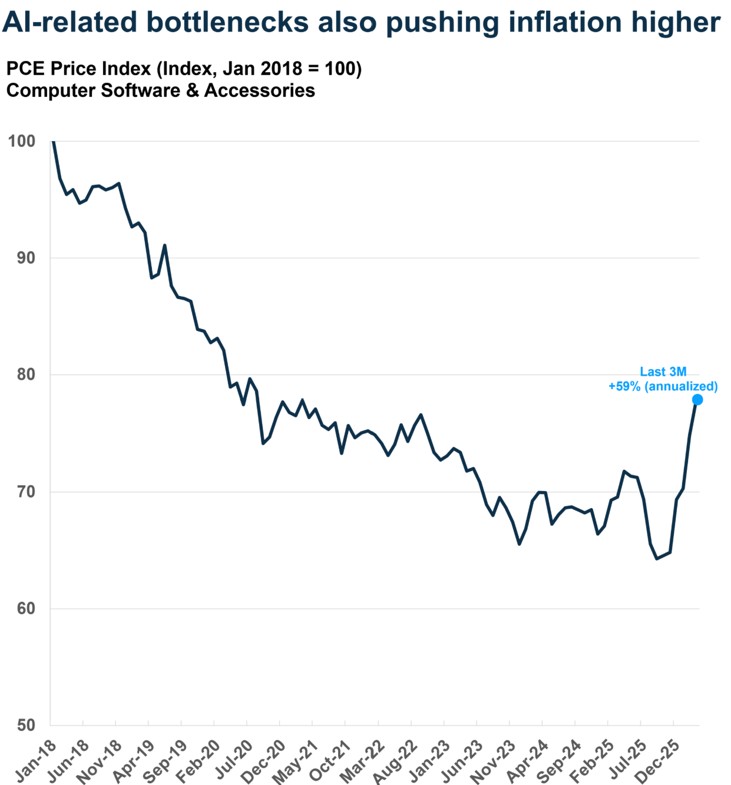
Source: FRED
Of course, AI-related bottlenecks are just one among many problems within the inflation data as inflation continues to creep higher.
Final Thoughts
We expect the AI wave to continue supporting the stock market, even as inflation remains elevated. Looking ahead, a Federal Reserve that is led by Kevin Warsh is likely to hold rates unchanged for the rest of the year. However, with inflation moving in the wrong direction, that means policy is actually getting more dovish. Couple that with rising fiscal deficits, and it means the Fed is likely to let the economy run hot, with nominal GDP growth continuing to clock in around 5% to 6%. For now, that is a potential tailwind for stocks.Top of FormBottom of Form
It is our aim at Asbury Wealth Partners that you find the market commentary we provide informative and useful. As our success grows mainly through referrals from our clients, we encourage you to share this weekly newsletter with your friends, family, and colleagues. If you are a client, we thank you for your business and your confidence. If you are not yet a client, we encourage you to contact us today and explore how our team may be able to add value to your unique financial situation.
Thank You,
Jeff
~~~~~~~~~~~~~~~~~~~~~~~
Jeffrey S. Markewich
Wealth Advisor
Off – 719-548-8103
Cell - 719-357-7747
Text – 702-493-9678
TF - 888-328-7655
~~~~~~~~~~~~~~~~~~~~~~~
An Introduction to Your Friends & Family
is the Greatest Compliment You Can Give
Jeffrey Markewich is a Registered Representative with, and securities and advisory services offered through LPL Financial, a registered investment advisor, Member FINRA/SIPC.
The information contained in this email message is being transmitted to and is intended for the use of only the individual(s) to whom it is addressed. If the reader
of this message is not the intended recipient, you are hereby advised that any dissemination, distribution or copying of this message is strictly prohibited. If you have received this message in error, please reply and you will be removed.
These views are those of the author, not of the broker-dealer or its affiliates. This material contains an assessment of the market and economic environment at a specific point in time and is not intended to be a forecast of future events, or a guarantee of future results. All investments involve risk, including loss of principal. Forward-looking statements are subject to certain risks and uncertainties. Actual results, performance, or achievements may differ materially from those expressed or implied. Information is based on data gathered from what we believe are reliable sources.
The NASDAQ Composite Index measures all NASDAQ domestic and non-U.S. based common stocks listed on The NASDAQ Stock Market. The market value, the last sale price multiplied by total shares outstanding, is calculated throughout the trading day, and is related to the total value of the Index.
S&P 500 – A capitalization-weighted index of 500 stocks designed to measure performance of the broad domestic economy through changes in the aggregate market value of 500 stocks representing all major industries.
The Dow Jones Industrial Average is comprised of 30 stocks that are major factors in their industries and widely held by individuals and institutional investors.
The Russell 2000 Index is an unmanaged index generally representative of the 2,000 smallest companies in the Russell 3000 index, which represents approximately 10% of the total market capitalization of the Russell 3000 Index.
The CBOE Volatility Index? (VIX?) is meant to be forward looking, showing the market's expectation of 30-day volatility in either direction, and is considered by many to be a barometer of investor sentiment and market volatility, commonly referred to as “Investor Fear Gauge”.
International investing involves special risks such as currency fluctuation and political instability and may not be suitable for all investors.
All indexes referenced are unmanaged. The volatility of indexes could be materially different from that of a client’s portfolio. Unmanaged index returns do not reflect fees, expenses, or sales charges. You cannot invest directly in an index. Consult your financial professional before making any investment decision.
There is no guarantee that a diversified portfolio will enhance overall returns or outperform a non-diversified portfolio. Diversification does not protect against market risk.
Asset allocation does not ensure a profit or protect against a loss.
The Consumer Price Indexes (CPI) program produces monthly data on changes in the prices paid by urban consumers for a representative basket of goods and services (Source: U.S. Department of Labor).
The Gross Domestic Product (GDP) is a comprehensive measure of U.S. economic activity. GDP measures the value of the final goods and services produced in the United States (without double counting the intermediate goods and services used up to produce them). Changes in GDP are the most popular indicator of the nation's overall economic health.
Government bonds and Treasury bills are guaranteed by the US government as to the timely payment of principal and interest and, if held to maturity, offer a fixed rate of return and fixed principal value.
LPL Tracking # 1106583