


Market Insights 4/20/26
Observations & Insights – April 20, 2026
We want to thank all who attended our 3rd Saturday Cars & Coffee this past weekend. It turned out to be a great day with some great people and their cars.
The next Cars & Coffee will be on Saturday, May 16th, see you there.
Stocks Surge!
Easing Middle East tensions and sliding oil prices fueled optimism, pushing the S&P 500 to three consecutive daily record highs starting on Wednesday. The index finished 4.5% higher for the week, and the NASDAQ’s 6.8% rise also pushed that index back to record heights. The Dow’s relatively modest 3.2% increase left it just -1.5% below its historic peak.
Key Points
- Stocks bounced for a third week, as optimism around ending the Iran war climbed, sending crude oil lower
- The S&P 500 has soared again last week, closing at all-time highs.
- The odds that the lows could be in are increasing; of course, a turn for the worse in the Middle East could change things quickly.
- Energy-driven inflation has surged, lifting headline CPI, and is likely to broaden out to other categories albeit on a temporary basis.
- The Fed faces a dilemma as energy, tariffs, and strong services demand echo early 1970s dynamics amidst a falling unemployment rate.
Observations: Growth Stocks Roar as Oil Sells Off
Friday’s rally marked the 13th positive trading session in a row for the NASDAQ, the longest such streak since 1992, punctuating a nearly three-week surge that began on March 31. Each of the major U.S. indexes climbed more rapidly during that stretch than they declined beginning in late February as tensions rose in the Middle East.
A two-week decline in oil prices accelerated on Friday as shipping disruptions eased in the Strait of Hormuz. U.S. crude was trading around $83 per barrel on Friday afternoon, down from around $96 a week earlier and a recent peak of about $113 on April 7. On a year-to-date basis, however, oil was up more than 40% as of Friday.
U.S. growth stocks outpaced their value counterparts by a wide margin for the third week in a row, eroding the value style’s still-sizable year-to-date performance lead over growth. A growth benchmark finished 6.7% higher for the week, versus a 2.4% rise for a value index.
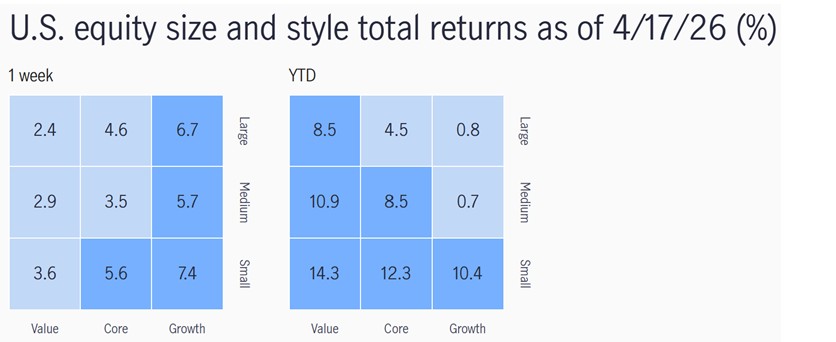
Source: John Hancock
Most of the big U.S. banks that opened earnings season reported better-than-expected results, lifted by higher trading revenue. As of Friday, analysts projected that financials sector earnings rose 19.7% in the first quarter, according to FactSet. That is above the 15.1% average gain that analysts had forecast for the sector entering the week.
A U.S. small-cap stock benchmark climbed to a record high on Thursday, surpassing its prior peak set nearly two months earlier. The Russell 2000 Index climbed 5.6% for the week. Just four weeks earlier, the index had entered a correction after falling 10% below its recent peak.
Prices of U.S. government bonds rose, sending yields lower for the fourth week in a row amid easing concerns about inflation risks. The yield of the 10-year Treasury note finished the week at 4.24%, down from a recent peak of 4.44% on March 27.
Although U.S. producer prices climbed in March, the gain was far below the level that most economists had expected, given the recent rise in energy costs. Tuesday’s release of the Producer Price Index showed a monthly gain of 0.5% versus the 1.1% consensus forecast of economists. Higher gasoline prices accounted for about half of the overall gain.
Insights: A Rare and Powerful Bounce, but Inflation Still Matters
Stocks continued their impressive rebound last week, extending one of the strongest short-term recoveries we have seen in years. The market’s rally has been fueled by easing geopolitical fears, a sharp decline in oil prices from recent highs, and renewed confidence that the economy remains on firmer footing than many feared just a few weeks ago. When sentiment gets overly pessimistic, markets often turn higher long before the headlines improve and that appears to be exactly what is happening.
Source: StockCharts
The speed of this rebound is notable. Sharp advances over short periods are relatively uncommon and often occur when investors are under-positioned, heavily hedged, or expecting further downside. In other words, many investors were bracing for more trouble just as conditions began to stabilize. That helps explain why rallies can become so forceful once they start. Cash on the sidelines, short covering, and a scramble to re-enter risk assets can create powerful momentum.
We continue to believe the broader bull market remains intact. Economic growth has slowed from the post-stimulus surge, but it has not broken down. Corporate earnings are still proving resilient, consumers remain employed, and capital spending tied to artificial intelligence and infrastructure continues to support activity beneath the surface. Importantly, earnings expectations for many companies have held up far better than the sentiment data would suggest.
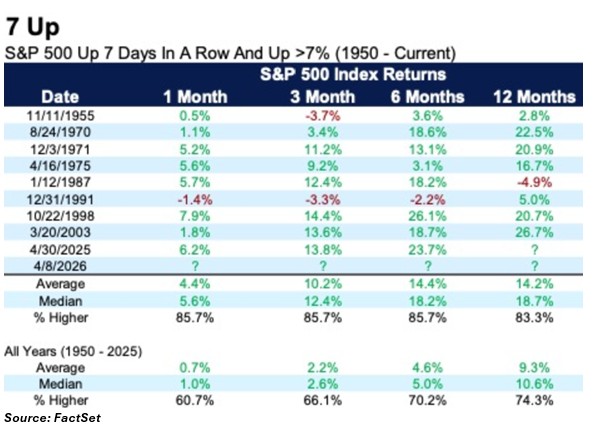
Seven Up Days
The S&P 500 fell -9.1% from the late January peak until the March 30 low. Although the headlines and the oil market volatility were extreme, most years tend to see at least a double-digit peak-to-trough correction. And after the bull run stocks had over the past few years, some early mid-term year weakness is not a surprise.
Now stocks are moving higher, and it has been impressive, with the S&P 500 recently up seven days in a row but also up more than 9% during that long win streak. We looked at previous times stocks were up seven days in a row and up at least 7%, and this is a rare and potentially very bullish signal.
There were eight other times we saw this rare bullish combo, and the good news is the future returns were quite strong, potentially another clue the worst is indeed behind us. Incredibly, the S&P 500 was up more than 10% on average three months later, something that we sure would not complain about if we saw it again.
Inflation Still Sticky
That said, two things can be true at once: stocks can rally, and inflation can still be a challenge. While lower oil prices helped calm markets, several underlying inflation pressures remain stubborn. Services inflation, wage pressures, housing-related costs, and large fiscal deficits all suggest the Federal Reserve may remain cautious. Markets may be celebrating better news today, but the path to aggressive rate cuts still looks uncertain.
Source: FRED
Higher rates for longer is not necessarily bearish for equities if growth and earnings remain healthy, but it does mean markets may need to work harder for gains. Valuations matter more in a higher-rate world, leadership can narrow quickly, and volatility may return whenever inflation data surprises to the upside.
From an investment standpoint, this remains an environment that rewards balance. We continue to favor quality businesses with durable earnings, reasonable pricing power, and exposure to long-term growth themes. We also believe market broadening remains a constructive signal, with gains increasingly coming from areas beyond just a handful of mega-cap names.
Final Thoughts
These past two weeks were a strong reminder that markets often move ahead of the news cycle. Just when fear seemed most entrenched, stocks staged a rare and powerful rally.
At the same time, investors should not confuse relief with resolution. Inflation pressures have not fully disappeared, the Federal Reserve still faces a complicated backdrop, and the geopolitical situation can literally turn on a tweet! Our view remains that this is an ongoing bull market, but one that is likely to include rotations, volatility, and periodic scares along the way. Patience, discipline, and staying focused on long-term fundamentals remain the most valuable tools investors have.
Top of Form
Bottom of Form
It is our aim at Asbury Wealth Partners that you find the market commentary we provide informative and useful. As our success grows mainly through referrals from our clients, we encourage you to share this weekly newsletter with your friends, family, and colleagues. If you are a client, we thank you for your business and your confidence. If you are not yet a client, we encourage you to contact us today and explore how our team may be able to add value to your unique financial situation.
Thank You,
Jeff
~~~~~~~~~~~~~~~~~~~~~~~
Jeffrey S. Markewich
Wealth Advisor
Off – 719-548-8103
Cell - 719-357-7747
Text – 702-493-9678
TF - 888-328-7655
~~~~~~~~~~~~~~~~~~~~~~~
An Introduction to Your Friends & Family
is the Greatest Compliment You Can Give
Jeffrey Markewich is a Registered Representative with, and securities and advisory services offered through LPL Financial, a registered investment advisor, Member FINRA/SIPC.
The information contained in this email message is being transmitted to and is intended for the use of only the individual(s) to whom it is addressed. If the reader
of this message is not the intended recipient, you are hereby advised that any dissemination, distribution or copying of this message is strictly prohibited. If you have received this message in error, please reply and you will be removed.
These views are those of the author, not of the broker-dealer or its affiliates. This material contains an assessment of the market and economic environment at a specific point in time and is not intended to be a forecast of future events, or a guarantee of future results. All investments involve risk, including loss of principal. Forward-looking statements are subject to certain risks and uncertainties. Actual results, performance, or achievements may differ materially from those expressed or implied. Information is based on data gathered from what we believe are reliable sources.
The NASDAQ Composite Index measures all NASDAQ domestic and non-U.S. based common stocks listed on The NASDAQ Stock Market. The market value, the last sale price multiplied by total shares outstanding, is calculated throughout the trading day, and is related to the total value of the Index.
S&P 500 – A capitalization-weighted index of 500 stocks designed to measure performance of the broad domestic economy through changes in the aggregate market value of 500 stocks representing all major industries.
The Dow Jones Industrial Average is comprised of 30 stocks that are major factors in their industries and widely held by individuals and institutional investors.
The Russell 2000 Index is an unmanaged index generally representative of the 2,000 smallest companies in the Russell 3000 index, which represents approximately 10% of the total market capitalization of the Russell 3000 Index.
The CBOE Volatility Index? (VIX?) is meant to be forward looking, showing the market's expectation of 30-day volatility in either direction, and is considered by many to be a barometer of investor sentiment and market volatility, commonly referred to as “Investor Fear Gauge”.
International investing involves special risks such as currency fluctuation and political instability and may not be suitable for all investors.
All indexes referenced are unmanaged. The volatility of indexes could be materially different from that of a client’s portfolio. Unmanaged index returns do not reflect fees, expenses, or sales charges. You cannot invest directly in an index. Consult your financial professional before making any investment decision.
There is no guarantee that a diversified portfolio will enhance overall returns or outperform a non-diversified portfolio. Diversification does not protect against market risk.
Asset allocation does not ensure a profit or protect against a loss.
The Consumer Price Indexes (CPI) program produces monthly data on changes in the prices paid by urban consumers for a representative basket of goods and services (Source: U.S. Department of Labor).
The Gross Domestic Product (GDP) is a comprehensive measure of U.S. economic activity. GDP measures the value of the final goods and services produced in the United States (without double counting the intermediate goods and services used up to produce them). Changes in GDP are the most popular indicator of the nation's overall economic health.
Government bonds and Treasury bills are guaranteed by the US government as to the timely payment of principal and interest and, if held to maturity, offer a fixed rate of return and fixed principal value.
LPL Tracking #1095451