


Market Insights 3/30/2026
Observations & Insights – March 30, 2026
Stocks Stuck in a Rut
The U.S. stock market’s positive Monday momentum failed to hold as sell-offs on Thursday and Friday left the major indexes down overall for the fifth week in a row. The NASDAQ dropped -3.2%, the S&P 500 fell -2.1%, and the Dow retreated -0.9%.
Key Points
- Stocks declined for a fifth straight week as geopolitical uncertainty and rising interest rates weighed on sentiment, pushing major indexes toward correction territory.
- Energy has been the clear standout, surging on elevated oil prices tied to the Iran conflict, while most other sectors struggle.
- Market leadership is shifting, as value, small-cap, and mid-cap stocks outperformed relative to growth stocks amid rising volatility and higher yields.
- Despite negative headlines and weakening sentiment, corporate earnings and profit margins remain strong and continue to support the long-term outlook.
- History shows that pullbacks and volatility are normal, and periods of heightened fear often create opportunities for disciplined, long-term investors.
Observations: Stocks Decline, Oil Rises as War Uncertainty Takes Toll
The NASDAQ on Thursday entered a correction, as the index closed down more than -10% below its record high set about five months earlier. The Dow followed suit on Friday, and the S&P 500 slipped closer to the 10% correction threshold, as it ended the week -8.7% below the record level that it achieved in late January.
The recent surge in oil and natural gas prices continued to provide lift for energy stocks, as the S&P 500’s energy sector finished up more than 6% for the week. Since March 1, energy has gained nearly 13%, making it the only sector in positive territory over that time frame. Year to date, the sector has added 41%. Oil prices are likely to stay elevated until there is a resolution to the Iran war and a re-opening of the Straits of Hormuz.
U.S. market volatility continued to weigh more heavily on growth stocks than on their value counterparts, reversing course after the growth style’s outperformance in 2025. A growth stock benchmark fell -3.4% for the week while its value counterpart slipped just -0.5%. On a year-to-date basis, growth was down almost -13% versus a fractional gain for value.
Prices of U.S. government bonds fell for the fourth week in a row amid diminished expectations of future rate cuts, lifting the yield of the 10-year U.S. Treasury to 4.43%, the highest in more than eight months. The yield of the 2-year note briefly eclipsed the 4.00% level on Friday before finishing at 3.91%, slightly higher for the week.
A U.S. small-cap stock benchmark outperformed a large-cap counterpart by a wide margin, expanding smaller stocks’ year-to-date margin of outperformance. The Russell 2000 Index finished 0.5% higher for the week, while its large-cap counterpart, the Russell 1000 Index, fell 2.0%. Mid-cap stocks have outperformed as well.
A monthly gauge of U.S. consumer sentiment fell to the lowest level so far in 2026, reversing course after recent gains. The University of Michigan’s survey showed that sentiment fell to 53.3 from a 56.6 reading in February. Most economists had been expecting a smaller March decline to about 54.0.
A report due out on Friday will show whether February’s weaker-than-expected jobs numbers extended into March. In February, the net loss of 92,000 jobs marked the third jobs decline in five months. Friday’s report will be released on a day when U.S. financial markets will be closed for observance of Good Friday.
Insights: Lessons for Investors When Markets Become Volatile
“In investing, what is comfortable is rarely profitable.” — Robert Arnott
The rollercoaster market continues. News, rumors and Tweets are dominating the discussion, and no one seems to know what to really believe. In other words, uncertainty is driving markets to become more defensive.
This week, I want to take a bigger look at things and highlight several lessons that all investors need to know, especially in today’s volatile times. Investors should know this is a headline driven market. Any clarity on the Iran situation has the potential to turn markets around rapidly.
Volatility Happens
Even the best years have some bad days. Last year is a perfect example, as we experienced a near-bear market after Liberation Day, yet stocks soared back to new highs, and the year ended as another good year for the bulls.
We all want to gain 20% a year with limited volatility forever, but as markets are driven by sentiment in the short-term, that is not possible. To see the solid returns that stocks can provide in the long run, we have to be able to withstand the inevitable volatility and bad times.
During times like this, we like to share this chart. On average, you get one 10% correction and more than three 5% mild corrections every year. Given we just saw our first mild correction this year, it is a good time to remember that it is perfectly normal to see some market jitters and volatility, as it happens most years.
Source: Ned Davis Research
Earnings & Margins Drive Long-Term Stock Gains
We get it, the headlines are quite bad, and confusion reigns. But as of now, we do not see a pending recession in the US, and by the end of 2026, it should be another solid year for investors.
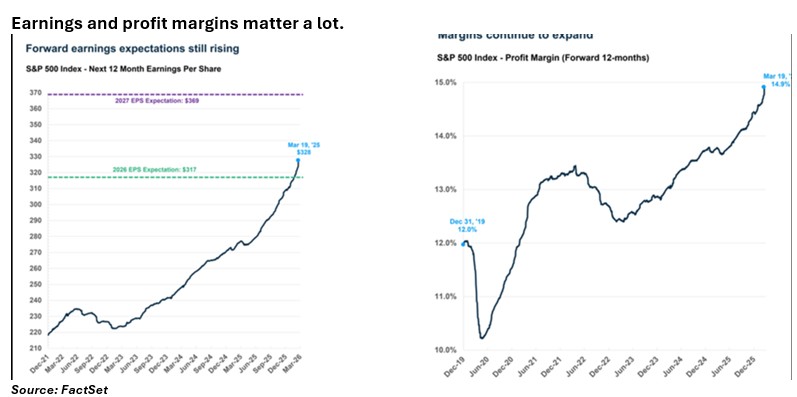
One bit of good news is that earnings continue to soar, with various groups showing no major stress from a change in consumer or business demand yet. Last week, we saw various airlines report solid guidance, and AI demand has shown no signs of slowing either. In the end, S&P 500 forward 12-month earnings estimates hit another new high last week, as did profit margins. There aren’t many better indicators for what stocks will do than earnings and profit margins, and this should be comforting for investors. Even though the headlines are scary, it doesn’t mean we should ignore good news when it’s there.
Earnings and profit margins matter a lot.
The Negative Sentiment Is Building, That May Be a Good Thing
Yes, the S&P 500 was recently about -7% off the late January highs, but if you saw some of the sentiment indicators, you would think it’s much worse. That’s a good thing. Often, the more extreme the emotion, the greater the benefit of being contrarian. That doesn’t mean we’re calling a bottom. But greater fear means more bad news is likely already priced into the market, making an upside surprise more likely. Six years ago this week, for instance, stocks bottomed after a vicious 34% bear market during COVID, and, incredibly, in some cases, we see more fear now than during a 100-day pandemic year. Oh, and stocks have nearly tripled since then.
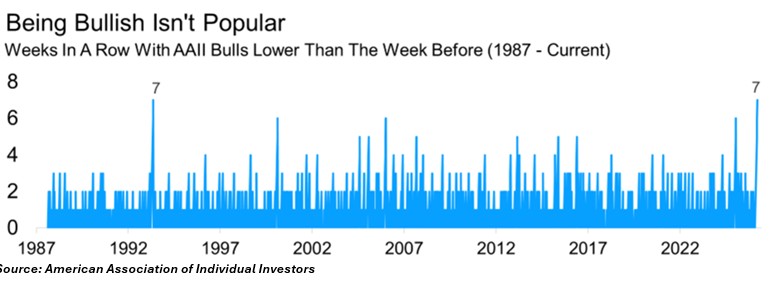
I looked at sentiment last week, but one more piece to the puzzle that caught my attention was that the number of bulls in the American Association of Individual Investors (AAII) has decreased a record-tying seven weeks in a row. We find out tomorrow if this will go to a record eight, but either way, this is another way to show just how on edge most investors really are.
Corrections And Bear Markets Happen
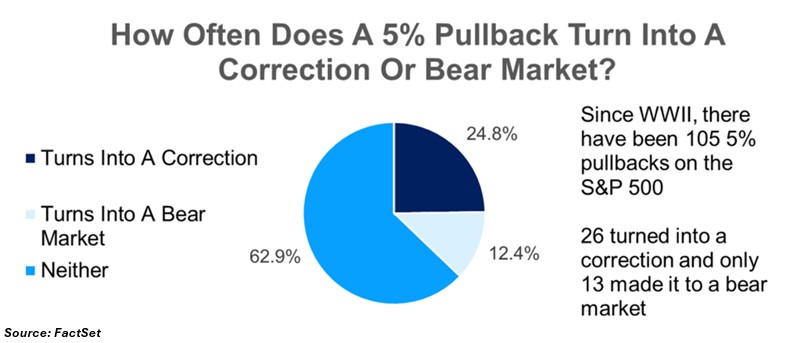
The S&P 500 moved into a -5% mild pullback last week. The big question now is, could it get worse? We looked at all the -5% mild pullbacks since World War II and found that things moved into a correction (down -10%) about 25% of the time, and only 12.4% of the time did it move into a bear market (down -20%).
Of course, if the situation in the Middle East gets worse, then the selloff could absolutely get worse. But with so many anticipating the worst and expecting another bear market right around the corner, it is important to put into context that the most likely scenario is that stocks don’t go into a bear market, which remains our base case.
Putting 2026 Into Perspective
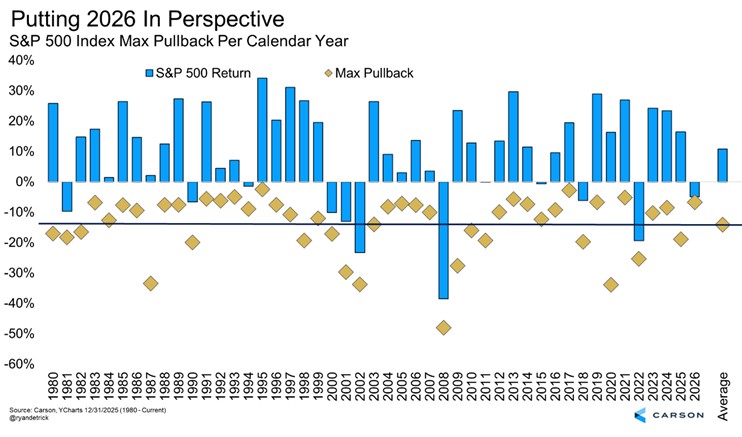
The final lesson to always remember is that most years have scary pullbacks, yet when all is said and done, the full year usually does just fine. Last year, for instance, saw stocks down 15% for the year in early April, and pure panic was in the air, yet in the end, stocks still gained close to 17%.
Looking at all the years since 1980, the average peak-to-trough correction was -14.1%, with the full year up a very solid 10.7%. Investors can do themselves a big favor by expecting stocks to see a double-digit correction each year. If it does not happen, that is great. But if it does? You are better prepared for it.
Peeling back the onion a tad more, 24 years (out of the past 46 since 1980, more than half) were down at least double digits at some point during the year, and 14 times stocks finished the year higher. In fact, the average full-year gain over those 14 years was a very impressive 17.4%.
There is a good chance that in each of those years when stocks were down at least double digits, the overall feeling was one of worry. They say the stock market is the only place where things go on sale and everyone runs out of the store screaming, and I agree. When you look at it this way, you can plan for weakness and volatility and use them to your advantage.
Final Thoughts
In conclusion, the headlines and volatility are not fun for anyone, but it is all part of longer-term investing. We remain optimistic that this too shall pass, and investors will be rewarded once again for sticking to their investment plans.
It is our aim at Asbury Wealth Partners that you find the market commentary we provide informative and useful. As our success grows mainly through referrals from our clients, we encourage you to share this weekly newsletter with your friends, family, and colleagues. If you are a client, we thank you for your business and your confidence. If you are not yet a client, we encourage you to contact us today and explore how our team may be able to add value to your unique financial situation.
Thank You,
Jeff
~~~~~~~~~~~~~~~~~~~~~~~
Jeffrey S. Markewich
Wealth Advisor
Off – 719-548-8103
Cell - 719-357-7747
Text – 702-493-9678
TF - 888-328-7655
~~~~~~~~~~~~~~~~~~~~~~~
An Introduction to Your Friends & Family
is the Greatest Compliment You Can Give
Jeffrey Markewich is a Registered Representative with, and securities and advisory services offered through LPL Financial, a registered investment advisor, Member FINRA/SIPC.
The information contained in this email message is being transmitted to and is intended for the use of only the individual(s) to whom it is addressed. If the reader
of this message is not the intended recipient, you are hereby advised that any dissemination, distribution or copying of this message is strictly prohibited. If you have received this message in error, please reply and you will be removed.
These views are those of the author, not of the broker-dealer or its affiliates. This material contains an assessment of the market and economic environment at a specific point in time and is not intended to be a forecast of future events, or a guarantee of future results. All investments involve risk, including loss of principal. Forward-looking statements are subject to certain risks and uncertainties. Actual results, performance, or achievements may differ materially from those expressed or implied. Information is based on data gathered from what we believe are reliable sources.
The NASDAQ Composite Index measures all NASDAQ domestic and non-U.S. based common stocks listed on The NASDAQ Stock Market. The market value, the last sale price multiplied by total shares outstanding, is calculated throughout the trading day, and is related to the total value of the Index.
S&P 500 – A capitalization-weighted index of 500 stocks designed to measure performance of the broad domestic economy through changes in the aggregate market value of 500 stocks representing all major industries.
The Dow Jones Industrial Average is comprised of 30 stocks that are major factors in their industries and widely held by individuals and institutional investors.
The Russell 2000 Index is an unmanaged index generally representative of the 2,000 smallest companies in the Russell 3000 index, which represents approximately 10% of the total market capitalization of the Russell 3000 Index.
The CBOE Volatility Index? (VIX?) is meant to be forward looking, showing the market's expectation of 30-day volatility in either direction, and is considered by many to be a barometer of investor sentiment and market volatility, commonly referred to as “Investor Fear Gauge”.
International investing involves special risks such as currency fluctuation and political instability and may not be suitable for all investors.
All indexes referenced are unmanaged. The volatility of indexes could be materially different from that of a client’s portfolio. Unmanaged index returns do not reflect fees, expenses, or sales charges. You cannot invest directly in an index. Consult your financial professional before making any investment decision.
There is no guarantee that a diversified portfolio will enhance overall returns or outperform a non-diversified portfolio. Diversification does not protect against market risk.
Asset allocation does not ensure a profit or protect against a loss.
The Consumer Price Indexes (CPI) program produces monthly data on changes in the prices paid by urban consumers for a representative basket of goods and services (Source: U.S. Department of Labor).
The Gross Domestic Product (GDP) is a comprehensive measure of U.S. economic activity. GDP measures the value of the final goods and services produced in the United States (without double counting the intermediate goods and services used up to produce them). Changes in GDP are the most popular indicator of the nation's overall economic health.
Government bonds and Treasury bills are guaranteed by the US government as to the timely payment of principal and interest and, if held to maturity, offer a fixed rate of return and fixed principal value.
LPL Tracking #1085717