


Market Insights 3/23/26
Observations & Insights – March 23, 2026
THANK YOU for coming out to 3rd Saturday Cars & Coffee. We had 120+ cars, new friends and a lot of fun.
Next month C&C will be on 4/18, from 10 AM-Noon, at our office.
Market Negativity Mounts
The stock market’s positive early-week momentum did not hold, and the major U.S. indexes finished the week down roughly -2%. The market’s fourth negative week in a row left the S&P 500 -6.8% below the record high it reached in late January. The NASDAQ was -9.6% below its October 2025 peak, just shy of the -10% threshold for an official correction.
Key Points
- Stocks fell for the fourth consecutive week. The S&P 500 is down -7% from its record high and -5% in 2026 year-to-date.
- Inflation was already becoming a problem before the conflict, but now the Fed is clearly in a tough spot.
- We think the odds of no rate hikes this year are underestimated, but that the economy is healthy enough to tolerate it.
- We still think we are in a bull market and will see higher prices over the year, but we are likely still in for more choppiness near-term.
Observations: Oil Stabilizes, Bond Yields Surge & the Fed Holds
After two weeks of surging oil prices, U.S. crude remained relatively stable but at elevated levels. On Friday afternoon, oil was trading around $99 per barrel, up slightly from about $98 at the end of the previous week, but well above a recent low of around $65 in late February. Year to date, oil was up 74%.
Prices of U.S. government bonds fell for the third week in a row, lifting the yield of the 10-year U.S. Treasury to Friday’s close of 4.39%—the highest level in about eight months. The yield of the 2-year note climbed more sharply to 3.90% amid concerns about inflation and the prospect of fewer rate cuts ahead.
The U.S. Federal Reserve kept its key interest rate unchanged for the second meeting in a row, in line with market expectations. Policymakers maintained their forecast for one additional rate cut this year, and Chair Jerome Powell expressed concern that inflation remains elevated amid economic and geopolitical uncertainty.
The U.S. Federal Reserve had plenty of company around the globe in keeping its key benchmark interest rate unchanged amid concerns about inflationary pressures. On Thursday, central banks in Japan, England, Sweden, and Switzerland also kept their key rates intact.
Gold prices dropped nearly 10%, falling for the third week in a row and interrupting a precious metals rally that dates to early 2025. Gold futures were trading around $4,500 per ounce on Friday afternoon, down from a record high of more than $5,500 set in late January.
A report on U.S. wholesale price trends raised concerns about prospects for increased inflationary pressures at the consumer level. The Produce Price Index posted a 0.7% month-over-month gain in February, well above economists’ consensus expectations for a 0.3% increase and above January’s 0.5% figure. On a year-over-year basis, headline prices rose by 3.4% in February.
Less than a month before companies begin reporting first-quarter results, analysts are expecting that companies in the S&P 500 will report double-digit earnings growth for the sixth consecutive quarter. As of Thursday, analysts surveyed by FactSet forecast the index’s year-over-year growth rate in the first quarter would be around 12.5%.
Insights: Why We Remain Bullish (For Now)
“If everybody is thinking alike, then somebody isn’t thinking.” -General George S. Patton
That quote has always resonated with me, second only to Mark Twain’s reminder that “history doesn’t repeat itself, but it often rhymes.” It is especially relevant today. While we continue to view this as a long-term bull market and do not currently see signs of an imminent recession, investor concerns have clearly intensified. The conflict with Iran, rising bond yields, and higher commodity prices—particularly oil—have all contributed to a more cautious tone in the market.
Having spent more than three decades in the markets, one lesson has remained constant: when a narrative becomes widely accepted, it is usually already reflected in prices. The real opportunity often lies in challenging consensus, not following it. That is much easier said than done, but some of the most meaningful investment decisions I have made came from leaning against prevailing sentiment.
We saw a clear example of this last April. Markets were under pressure, sentiment was overwhelmingly negative, and many investors had all but written off the outlook. Despite that, we maintained a constructive stance, recognizing that a significant amount of bad news had already been priced in. It ultimately did not take much positive news to spark a powerful rally that carried markets from the April 2025 lows through late October.
Today, we are seeing a similar setup. Measures of investor sentiment are again reflecting elevated fear and pessimism, levels that have historically been associated with important market lows. While a resolution or de-escalation in geopolitical tensions could certainly act as a catalyst, it is worth noting that many investors are already positioned defensively. In that environment, the “pain trade” may actually be a sharp rise in equity prices.
Here are some compelling reasons we see to remain bullish:
The CNN Fear & Greed Index is firmly negative and showing extreme investor fear. Here is the historical view of the index for context:
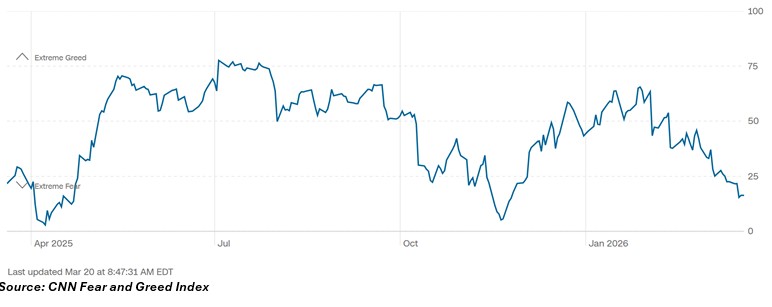
Source: CNN Fear and Greed Index
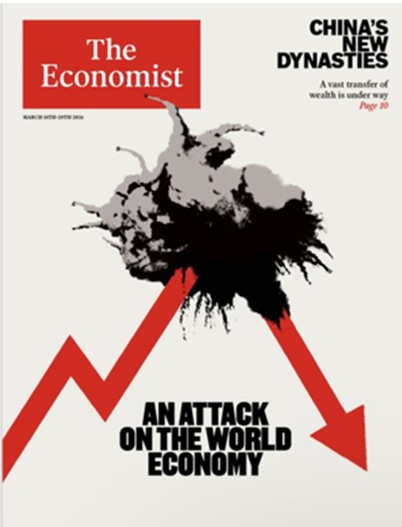
The Economist just had this doozy of a magazine cover. We do not blindly invest on magazine covers, but over-the-top covers like this historically can be a contrarian signal, especially when you see red arrows pointing lower.
The American Association of Individual Investors (AAII) Sentiment Poll has seen more bears than bulls for four weeks and the number of bears has spiked to the highest level since mid-November.
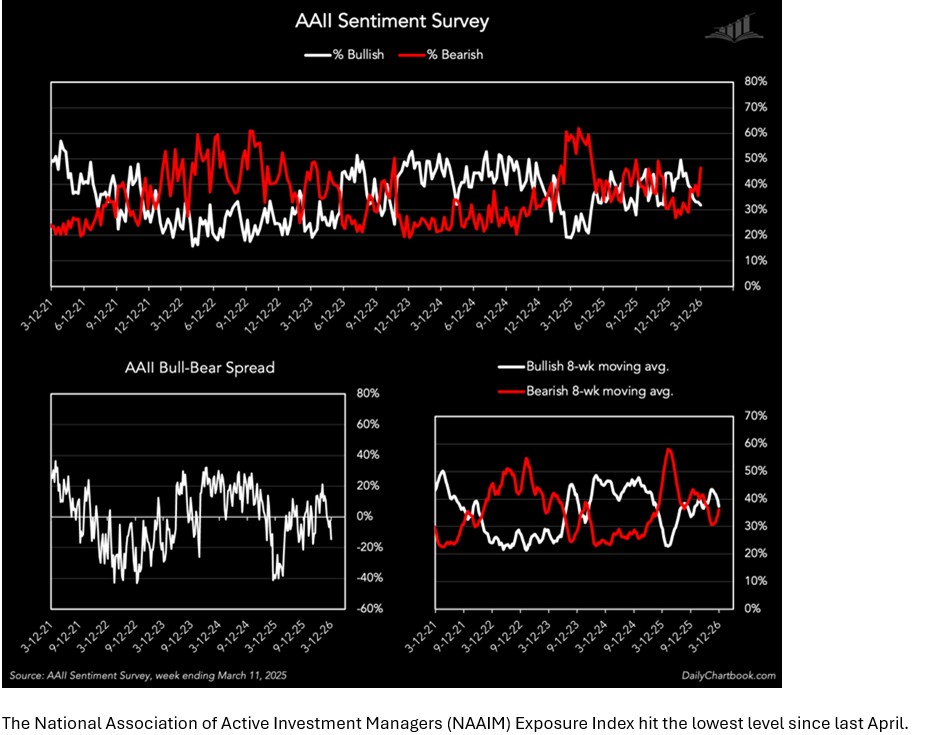
The National Association of Active Investment Managers (NAAIM) Exposure Index hit the lowest level since last April.
Source: NAAIM Exposure Index as of March 12, 2026
Those first four were examples of what we call soft sentiment (survey-based data). We pay attention to that, but we put more credence in hard data, what investors are doing with their actual money. Fortunately, we are seeing a lot of hedging and outright panic when we look at this too.
Last week saw the largest one week drop in Asset Managers’ net positioning (by dollar value) since the Covid crash.
Source: @subtrade
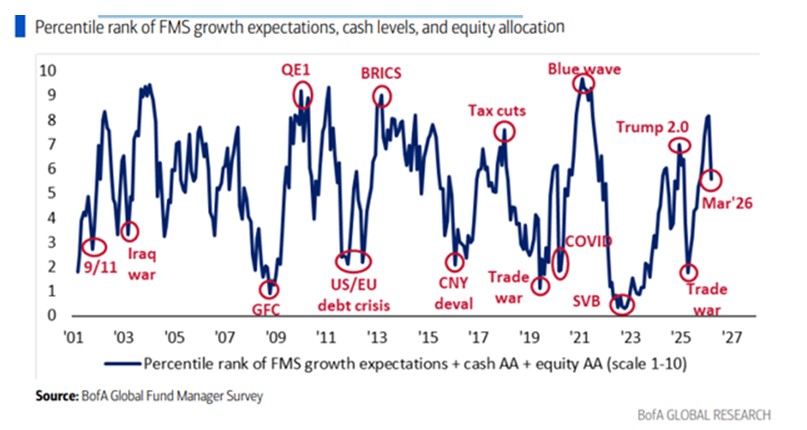
The Bank of American Global Fund Manager Survey saw a six-month low in investor sentiment.
Another sign that investors are running away from equities here, last week saw outflows from equity ETFs, something that rarely happens and that has not been seen since April of last year.
Goldman Sachs data showed a historic jump in ETF and index shorting last week, in line with some of the largest jumps ever.
Source: Goldman Sachs
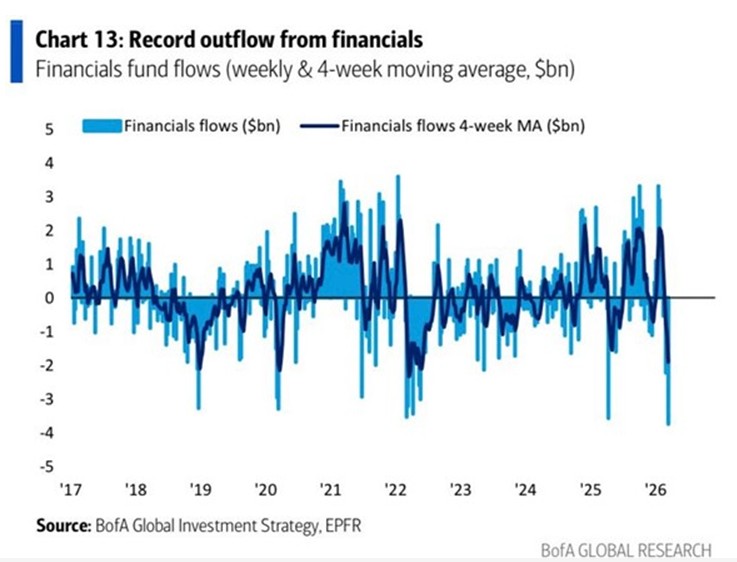
Last Thursday saw continued worries about private credit and the potential fallout. As a result, Bank of America data showed record outflows from financial funds.
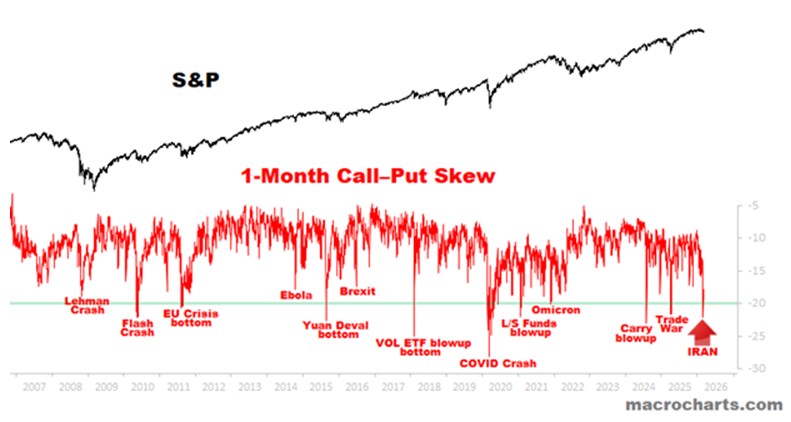
Call-Put skew is showing off the charts’ demand for put protection relative to calls. When everyone wants insurance and will pay nearly anything for it, it means a lot of bad news is likely priced in and as you can see below, previous negative spikes like this have occurred near market lows.
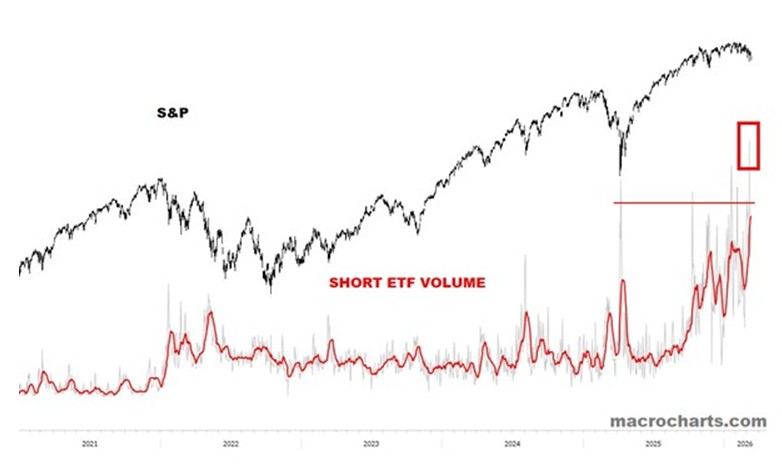
Here is another gem from Macro Charts, this time showing the ETF volume of short ETFs has hit the highest level EVER.
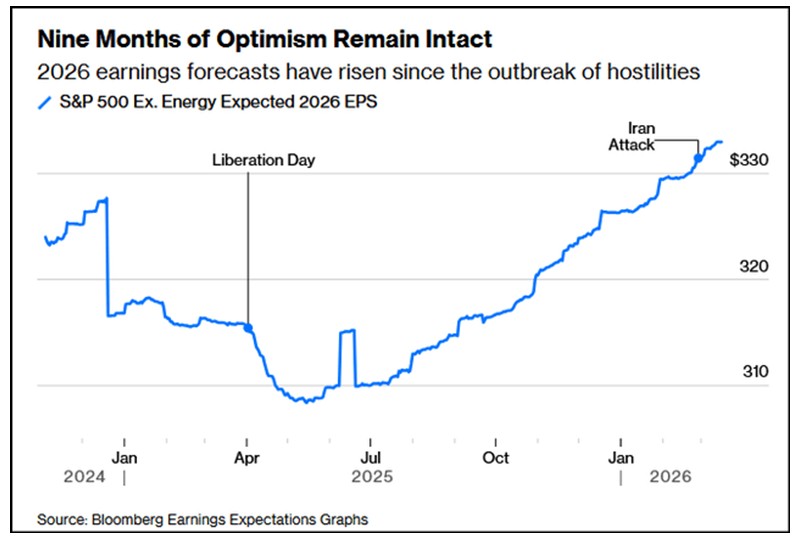
Finally, and maybe most importantly, earnings forecasts for S&P 500 companies have risen since start of hostilities with Iran. This is one of the more underappreciated developments is that corporate earnings expectations have held up—and in some cases improved—even amid geopolitical tensions. That resilience is important and does not align with the level of fear currently embedded in sentiment and positioning data.
Final Thoughts
While uncertainty has clearly increased, experience has shown that periods of elevated fear often create opportunity. When sentiment becomes this one-sided, markets tend to move in the opposite direction of the consensus view.
For now, the weight of the evidence suggests staying constructive, while remaining disciplined and mindful of the risks.
It is our aim at Asbury Wealth Partners that you find the market commentary we provide informative and useful. As our success grows mainly through referrals from our clients, we encourage you to share this weekly newsletter with your friends, family, and colleagues. If you are a client, we thank you for your business and your confidence. If you are not yet a client, we encourage you to contact us today and explore how our team may be able to add value to your unique financial situation.
Thank You,
Jeff
~~~~~~~~~~~~~~~~~~~~~~~
Jeffrey S. Markewich
Wealth Advisor
Off – 719-548-8103
Cell - 719-357-7747
Text – 702-493-9678
TF - 888-328-7655
www.CreateClarity.US
~~~~~~~~~~~~~~~~~~~~~~~
An Introduction to Your Friends & Family
is the Greatest Compliment You Can Give
Jeffrey Markewich is a Registered Representative with, and securities and advisory services offered through LPL Financial, a registered investment advisor, Member FINRA/SIPC.
The information contained in this email message is being transmitted to and is intended for the use of only the individual(s) to whom it is addressed. If the reader
of this message is not the intended recipient, you are hereby advised that any dissemination, distribution or copying of this message is strictly prohibited. If you have received this message in error, please reply and you will be removed.
These views are those of the author, not of the broker-dealer or its affiliates. This material contains an assessment of the market and economic environment at a specific point in time and is not intended to be a forecast of future events, or a guarantee of future results. All investments involve risk, including loss of principal. Forward-looking statements are subject to certain risks and uncertainties. Actual results, performance, or achievements may differ materially from those expressed or implied. Information is based on data gathered from what we believe are reliable sources.
The NASDAQ Composite Index measures all NASDAQ domestic and non-U.S. based common stocks listed on The NASDAQ Stock Market. The market value, the last sale price multiplied by total shares outstanding, is calculated throughout the trading day, and is related to the total value of the Index.
S&P 500 – A capitalization-weighted index of 500 stocks designed to measure performance of the broad domestic economy through changes in the aggregate market value of 500 stocks representing all major industries.
The Dow Jones Industrial Average is comprised of 30 stocks that are major factors in their industries and widely held by individuals and institutional investors.
The Russell 2000 Index is an unmanaged index generally representative of the 2,000 smallest companies in the Russell 3000 index, which represents approximately 10% of the total market capitalization of the Russell 3000 Index.
The CBOE Volatility Index? (VIX?) is meant to be forward looking, showing the market's expectation of 30-day volatility in either direction, and is considered by many to be a barometer of investor sentiment and market volatility, commonly referred to as “Investor Fear Gauge”.
International investing involves special risks such as currency fluctuation and political instability and may not be suitable for all investors.
All indexes referenced are unmanaged. The volatility of indexes could be materially different from that of a client’s portfolio. Unmanaged index returns do not reflect fees, expenses, or sales charges. You cannot invest directly in an index. Consult your financial professional before making any investment decision.
There is no guarantee that a diversified portfolio will enhance overall returns or outperform a non-diversified portfolio. Diversification does not protect against market risk.
Asset allocation does not ensure a profit or protect against a loss.
The Consumer Price Indexes (CPI) program produces monthly data on changes in the prices paid by urban consumers for a representative basket of goods and services (Source: U.S. Department of Labor).
The Gross Domestic Product (GDP) is a comprehensive measure of U.S. economic activity. GDP measures the value of the final goods and services produced in the United States (without double counting the intermediate goods and services used up to produce them). Changes in GDP are the most popular indicator of the nation's overall economic health.
Government bonds and Treasury bills are guaranteed by the US government as to the timely payment of principal and interest and, if held to maturity, offer a fixed rate of return and fixed principal value.
LPL Tracking #1082551