


Market Insights 3/16/26
Observations & Insights – March 16, 2026
3rd Saturday Cars & Coffee THIS WEEK
10am to Noon (attached). Weather looks to be NICE
Markets in Downtrend
The major U.S. stock indexes fell for the third consecutive week, with the S&P 500, the NASDAQ, and the Dow dropping around -1% to -2%. Geopolitical tensions and elevated oil prices continued to weigh on stock and bond prices.
Key Points
- Stocks fell for the third consecutive week. The S&P 500 is down 5% from its record high and 3% in 2026 year-to-date.
- A stronger-than-expected inflation report suggests core inflation remains sticky.
- The Iranian conflict and volatile energy prices complicates the Federal Reserve’s path toward interest-rate cuts.
- Friday’s GDP report showed the economy grew at an anemic 0.7% in the fourth quarter, well below estimates.
- Stocks have bottomed in March for the last 20 years.
Observations: Oil Goes on a Wild Ride, Inflation Remains Sticky
The three-week string of declines for the S&P 500 left the index nearly 5% below its record high reached on January 27 and almost -3% lower on a year-to-date basis. The NASDAQ was nearly- 8% below its October 29, 2025, record and down almost -5% year to date.
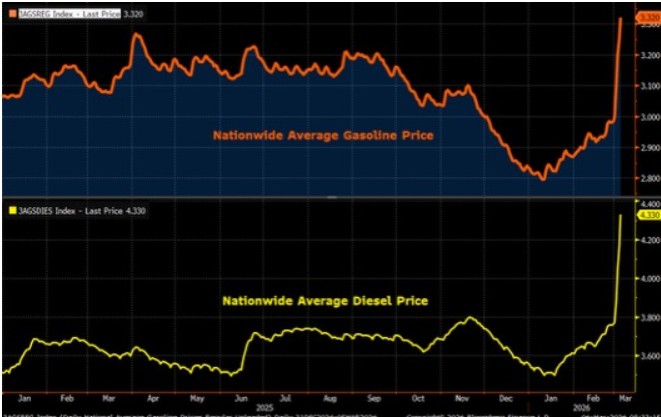
Conflict in the Middle East and curtailed shipments through the Strait of Hormuz fueled oil market volatility for a second week, with U.S. crude futures spiking to $119 per barrel on Monday and then briefly slipping below $77 the next day. On Friday afternoon, oil was trading around $98, up from a recent low of around $65 on February 27.
The U.S. Federal Reserve’s preferred gauge for measuring inflation remained well above the Fed’s long-term inflation target of 2%. Friday’s Personal Consumption Expenditures Price Index reading on core inflation, which excludes volatile food and energy prices, came in at 3.1% in January, slightly above December’s 3.0% reading. On a month-to-month basis, inflation rose 0.4%.
Prices of U.S. government bonds fell for the second week in a row, sending yields sharply higher, as elevated oil prices fueled inflationary pressures. The 10-year Treasury yield finished the week at 4.28%, up from 4.15% the previous week. As recently as February 27, the yield slipped to 3.96%, the lowest in more than four months.
The U.S. economy expanded at a far slower pace in late 2025 than an initial estimate had indicated. Friday’s revision showed that GDP grew at an annual rate of 0.7% in the fourth quarter. The figure was down from the 1.4% estimate released in February and well below the 4.4% rate recorded in last year’s third quarter.
An index that tracks investors’ expectations of short-term U.S. stock market volatility eased slightly for the week but remained elevated. The CBOE Volatility Index finished the week at 27.2, down from 29.5 at the end of the previous week. As recently as January 23, the VIX was below 16.
Bond market trading ahead of the U.S. Federal Reserve’s next meeting continued to support expectations of a policy pause in the wake of recent rate cuts. Friday’s trading in rate futures markets implied a 99% probability that the Fed would keep rates unchanged when it concludes its two-day meeting on Wednesday, March 18, according to CME FedWatch. At its most recent meeting in January, the Fed held steady after approving rate cuts at its three previous meetings.
Insights: Headlines vs. History
Recent market volatility has been driven largely by geopolitical headlines, particularly tensions involving Iran and the resulting swings in oil prices. While these developments can feel significant in the moment, history suggests geopolitical events rarely determine the long-term direction of financial markets.
Their economic impact typically comes through energy prices.
The recent conflict has highlighted the strategic importance of the Strait of Hormuz, one of the world’s most critical energy chokepoints. A significant portion of global oil shipments travels through this narrow passageway, meaning disruptions can quickly send energy prices sharply higher. That dynamic was clearly visible last week as oil prices experienced dramatic swings in response to changing headlines.
Higher oil prices can affect the economy in several ways. Rising fuel costs put pressure on consumers, increase input costs for businesses, and can complicate central bank efforts to bring inflation under control. If oil remains elevated for an extended period of time, it could delay the Federal Reserve’s timeline for lowering interest rates.
At the same time, incoming economic data suggests inflation pressures remain more persistent than many investors expected at the start of the year. The Federal Reserve’s preferred inflation measure, the Personal Consumption Expenditures Price Index, showed that core inflation accelerated to 3.1% in January, up from 3.0% the previous month. While the increase was modest, it highlights that the economy continues to battle underlying inflation pressures.
Monthly data reinforces this view. Headline inflation rose 0.3% from the previous month, a pace that remains above what policymakers would like to see. For inflation risks to be considered largely contained, investors would likely need to see several months of readings consistently closer to the 0.1%–0.2% range.
Digging deeper into the data reveals that some of the most persistent inflation pressures continue to come from the services sector. Core services excluding housing—often referred to by economists as “Supercore” inflation—accelerated to 3.5%, the fastest pace since February 2025. The increase was driven primarily by health care and financial services costs, two categories that economists expect could begin easing later this year as broader economic activity slows.
Complicating the picture further was a significant revision to economic growth. Fourth-quarter GDP was revised down to just 0.7%, well below the initial estimate and a sharp slowdown from the 4.4% growth recorded in the third quarter of last year. The combination of sticky inflation and slowing growth creates a challenging environment for policymakers attempting to balance the two sides of the Federal Reserve’s mandate: stable prices and maximum employment.
For now, policymakers appear to be in a holding pattern. Elevated energy prices and persistent inflation pressures make it difficult for the Fed to justify aggressive rate cuts in the near term. At the same time, signs of slowing growth and a cooling labor market argue against maintaining overly restrictive policy for too long.
The next round of forecasts from the Federal Reserve, released in its upcoming Summary of Economic Projections, may provide additional clarity. Given recent developments, investors should expect policymakers to highlight the unusually high degree of uncertainty surrounding both inflation and employment.
Inflation could remain elevated in the near term due to rising energy costs tied to the Middle East conflict, while disruptions in the labor market could begin to weigh more heavily on employment later this year. In other words, both sides of the Fed’s mandate may face new pressures simultaneously.
Periods like this, when economic data is mixed and geopolitical risks dominate the headlines, often create heightened uncertainty for investors. Yet history shows that markets rarely move in a straight line. Volatility and periodic corrections are a normal part of every market cycle.
Seasonality also provides an interesting perspective on the current environment. Over the past two decades, market corrections that began early in the year have frequently found their lows during the month of March. In many cases, pessimism peaks just as markets begin to stabilize and recover.
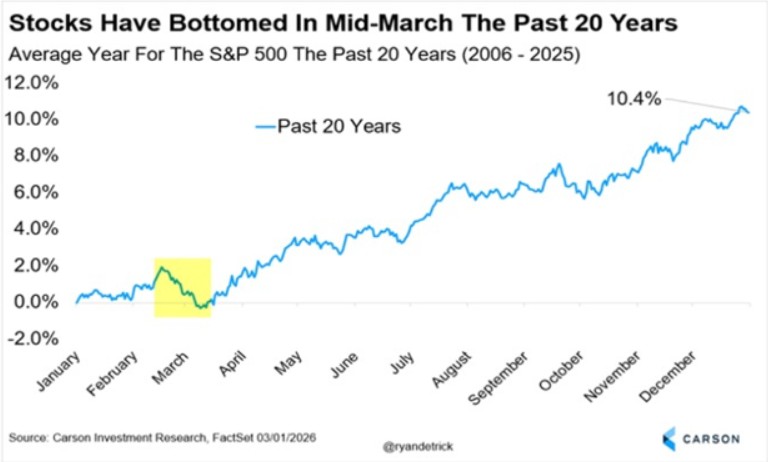
While seasonal patterns are never guarantees, they offer an important reminder that sentiment often reaches its most negative levels near potential turning points. Today’s environment—characterized by geopolitical tensions, volatile energy prices, slowing growth, and uncertainty around Federal Reserve policy—fits many of the conditions that historically have coincided with heightened investor anxiety.
Ironically, those moments often occur close to market bottoms rather than at the beginning of prolonged downturns.
For long-term investors, the key lesson is that headlines can drive short-term volatility, but fundamentals ultimately determine long-term returns. Corporate earnings, productivity, innovation, and economic growth remain the primary forces shaping market performance over time.
Final Thoughts
Financial markets are currently navigating a challenging mix of geopolitical uncertainty, elevated energy prices, persistent inflation, and slowing economic growth. While these factors have contributed to increased volatility in recent weeks, the broader market decline remains relatively modest compared with typical historical corrections.
Geopolitical conflicts can dominate the news cycle and influence investor sentiment, but history suggests their impact on long-term market performance is usually temporary. Markets have consistently demonstrated resilience in the face of political crises, economic shocks, and periods of uncertainty.
For investors, the most important discipline is maintaining a long-term perspective. Attempting to react to every headline or short-term market movement can often do more harm than good. Instead, focusing on fundamental trends and maintaining a diversified investment strategy has historically proven to be the most effective approach.
Periods of uncertainty can be uncomfortable, but they are also a normal and necessary part of the investment cycle. For patient investors, volatility often creates opportunity rather than permanent damage.
It is our aim at Asbury Wealth Partners that you find the market commentary we provide informative and useful. As our success grows mainly through referrals from our clients, we encourage you to share this weekly newsletter with your friends, family, and colleagues. If you are a client, we thank you for your business and your confidence. If you are not yet a client, we encourage you to contact us today and explore how our team may be able to add value to your unique financial situation.
Thank You,
Jeff
~~~~~~~~~~~~~~~~~~~~~~~
Jeffrey S. Markewich
Wealth Advisor
Off – 719-548-8103
Cell - 719-357-7747
Text – 702-493-9678
TF - 888-328-7655
~~~~~~~~~~~~~~~~~~~~~~~
An Introduction to Your Friends & Family
is the Greatest Compliment You Can Give
Jeffrey Markewich is a Registered Representative with, and securities and advisory services offered through LPL Financial, a registered investment advisor, Member FINRA/SIPC.
The information contained in this email message is being transmitted to and is intended for the use of only the individual(s) to whom it is addressed. If the reader
of this message is not the intended recipient, you are hereby advised that any dissemination, distribution or copying of this message is strictly prohibited. If you have received this message in error, please reply and you will be removed.
These views are those of the author, not of the broker-dealer or its affiliates. This material contains an assessment of the market and economic environment at a specific point in time and is not intended to be a forecast of future events, or a guarantee of future results. All investments involve risk, including loss of principal. Forward-looking statements are subject to certain risks and uncertainties. Actual results, performance, or achievements may differ materially from those expressed or implied. Information is based on data gathered from what we believe are reliable sources.
The NASDAQ Composite Index measures all NASDAQ domestic and non-U.S. based common stocks listed on The NASDAQ Stock Market. The market value, the last sale price multiplied by total shares outstanding, is calculated throughout the trading day, and is related to the total value of the Index.
S&P 500 – A capitalization-weighted index of 500 stocks designed to measure performance of the broad domestic economy through changes in the aggregate market value of 500 stocks representing all major industries.
The Dow Jones Industrial Average is comprised of 30 stocks that are major factors in their industries and widely held by individuals and institutional investors.
The Russell 2000 Index is an unmanaged index generally representative of the 2,000 smallest companies in the Russell 3000 index, which represents approximately 10% of the total market capitalization of the Russell 3000 Index.
The CBOE Volatility Index? (VIX?) is meant to be forward looking, showing the market's expectation of 30-day volatility in either direction, and is considered by many to be a barometer of investor sentiment and market volatility, commonly referred to as “Investor Fear Gauge”.
International investing involves special risks such as currency fluctuation and political instability and may not be suitable for all investors.
All indexes referenced are unmanaged. The volatility of indexes could be materially different from that of a client’s portfolio. Unmanaged index returns do not reflect fees, expenses, or sales charges. You cannot invest directly in an index. Consult your financial professional before making any investment decision.
There is no guarantee that a diversified portfolio will enhance overall returns or outperform a non-diversified portfolio. Diversification does not protect against market risk.
Asset allocation does not ensure a profit or protect against a loss.
The Consumer Price Indexes (CPI) program produces monthly data on changes in the prices paid by urban consumers for a representative basket of goods and services (Source: U.S. Department of Labor).
The Gross Domestic Product (GDP) is a comprehensive measure of U.S. economic activity. GDP measures the value of the final goods and services produced in the United States (without double counting the intermediate goods and services used up to produce them). Changes in GDP are the most popular indicator of the nation's overall economic health.
Government bonds and Treasury bills are guaranteed by the US government as to the timely payment of principal and interest and, if held to maturity, offer a fixed rate of return and fixed principal value.
LPL Tracking #1079466