

Market Insights 2/2/26
Sorry we missed last week. Technical difficulties....
Observations & Insights – February 2, 2026
Markets Reverse Direction
U.S. stocks started the week on a positive note, sending the S&P 500 to a record high on Wednesday, but the market turned negative on Friday and finished mixed overall for the week. The S&P 500 climbed slightly while the NASDAQ and the Dow both finished fractionally lower for the third week in a row.
Key Points
- Markets reversed after hitting yet another new high.
- The Fed left interest rates unchanged at their January meeting.
- President Trump announced Kevin Warsh as his nominee for the next Fed chairman.
- Precious metals reversed sharply on the new Fed chair announcement.
- The ISM Manufacturing Index Rose to 52.6 in January.
- We may be in for a period of increased volatility, but underlying conditions remain strong.
Observations: New Fed Chair Nominated
President Trump on Friday nominated former U.S. Federal Reserve Governor Kevin Warsh to replace Jerome Powell when the current Fed chair’s term ends in mid-May. Warsh now faces Senate confirmation. The nomination came two days after the Fed fulfilled market expectations by keeping its benchmark rate unchanged, initiating a policy pause after approving rate cuts at its three previous meetings.
Gold and silver prices rallied to record highs on Thursday, only to tumble on Friday and finish negative for the week following the nomination of a new Fed chair, Kevin Warsh, who is seen as a potential monetary “hawk”. Gold futures were trading for less than $4,900 per ounce late Friday afternoon, just a day after climbing as high as $5,586. Silver took an even steeper dive, sinking to around $82 per ounce on Friday after peaking at $121 the day before.
The U.S. stock market maintained modestly positive momentum in January, with each of the three major indexes posting monthly gains of around 1% to 2%. For the S&P 500, it was the eighth positive monthly result out of the past nine; for the Dow, it was the ninth positive month in a row.
Earnings season expectations continued to rise approaching the mid-point of quarterly reporting. As of Friday, analysts projected that earnings for S&P 500 companies rose 11.9% in the fourth quarter, up from an 8.2% forecast the previous week, according to FactSet. The figures are based on roughly one-third of companies that had reported results as of Friday, plus projections for those that haven’t yet released their numbers.
The ISM Manufacturing Index rose to 52.6 in January, easily beating the consensus expected 48.5. (Levels higher than 50 signal expansion; levels below 50 signal contraction.) Following nearly three years of contraction, factory activity accelerated unexpectedly to the fastest pace since 2022. This marks the first time the Index has been in expansion territory since it briefly rose above 50 last January and February. One month does not make a trend, but it is a welcome sign for an industry that has faced an army of headwinds in recent years.
The price of the most widely traded cryptocurrency was down around 4% for the week as of Friday afternoon, extending a decline that began last fall. Bitcoin was trading around $84,000, down from a record $125,000, reached less than four months earlier. As recently as January 13, Bitcoin was trading around $97,000.
A potential showdown with Iran led to a nearly 7% jump in the price of U.S. crude oil futures for the week as of Friday afternoon at roughly $66 per barrel, the highest level in more than four months. While oil was up around 13% on a year-to-date basis, it remained well below prices recorded in early 2025.
The monthly jobs report due out on Friday will show whether recent labor market weakness extended into January. In December, the economy generated a below-forecast 50,000 new jobs, capping a year in which payroll gains averaged 49,000 per month, less than one-third of 2024’s 168,000 average.
Insights: Sell America? Not So Fast…
The S&P 500 closed the week at yet another all-time high, extending a rally that has remained resilient despite the growing popularity of the so-called “Sell America” trade now circulating widely across trading desks and in the financial media. As usual, market anxieties are being tied to political leadership and a weaker U.S. dollar. When asked mid-week about the dollar’s decline, the President expressed little concern and from our perspective, that reaction makes sense.
Our broader macro thesis remains intact. We continue to believe the Federal Reserve is guiding policy toward a steeper yield curve and expect at least two rate cuts this year, with a reasonable chance of a third. While the exact timing is uncertain, a near-term cut followed by a pause and additional easing later in the year would be consistent with both historical precedent and the economic signals we track.
That timing is important. Many of the productivity, earnings, and GDP indicators we follow suggest acceleration developing toward the end of the second quarter and into the third. As those improvements show up in reported data, they should provide additional support for equities. We are coming off three consecutive years of double-digit gains, which naturally raises questions about sustainability. However, when viewed alongside the significant capital expenditure cycle building into 2026 and 2027, the case for a longer-running bull market remains compelling. This is a structural tailwind that will take years, not quarters, to fully play out.
That said, as we move toward February, some cracks are beginning to appear beneath the surface. Market internals are showing a more defensive tone, and the precious metals complex in particular is flashing signs of a meaningful topping process. While residual support remains in certain areas, the data suggest the first part of February could carry a more cautious, risk-off character as markets digest recent gains.
The fundamental backdrop remains supportive. The labor market continues to strengthen, with initial jobless claims falling to 209,000 and continuing claims declining to 1.827 million. This persistent improvement suggests consumer activity should remain resilient. From the standpoint of economic fundamentals capable of driving a sustained market downturn, we simply do not see that scenario developing at this time.
The recent risk-off tone and selling pressure may largely reflect month-end positioning and portfolio rebalancing. We have also seen renewed commentary from Europe questioning U.S. stability, often tied to tariffs and policy uncertainty. After a three-year stretch of strong equity returns in the United States, some degree of global diversification is both logical and expected. However, diversification should not be mistaken for abandonment. The United States remains a primary destination for global capital.
The weaker dollar, now at the center of much of the current anxiety, actually reinforces this point. On a longer-term basis, the dollar appears to be approaching well-established support, suggesting that while near-term pressure may persist, the more extreme debasement narratives are overstated. A softer dollar improves the competitiveness of U.S. exports and increases the purchasing power of foreign investors allocating into American assets. History offers useful parallels, including periods when dollar weakness coincided with strong U.S. equity performance driven by international inflows.
Dollar Index (DXY) 10-years
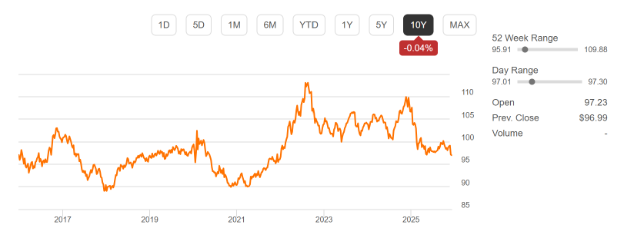
Source: Seeking Alpha (USD versus basket of currencies)
Leadership within the market reflects this rotation. Small- and mid-cap stocks led early in the year, while the S&P 500 and Nasdaq lagged modestly. With January ending and February ahead, some consolidation should not be surprising. As we have discussed in recent updates, softness is emerging in select areas, particularly parts of the technology sector, though the broader picture remains mixed rather than uniformly negative.
The most notable development this past week has been the sharp reversal in the metals complex. Gold has declined materially, while silver has seen even steeper losses. This move confirms the breakdown that technical conditions had been signaling. The surge and subsequent reversal in the gold-to-silver ratio marks an exhaustion of momentum consistent with a parabolic topping pattern. While some residual support remains, the tone across precious metals has clearly deteriorated.
Source: Seeking Alpha
The message from the overall market action is not one of impending collapse, but rather one of digestion, rotation, and risk management. The consumer remains firm, the economic foundation intact, and the medium-term structural drivers, capital investment, productivity gains, and policy easing, remain supportive. In the near term, we should expect profit-taking, reallocation, and periodic volatility. But as things stand, the path of least resistance for equities remains higher, even if the road forward is less smooth than the one behind us.
Final Thoughts
Stepping back from the near-term noise, our long-term conviction in the U.S. remains firmly intact. The combination of superior productivity, unmatched capital markets, sustained innovation, and a deep, flexible labor force continues to differentiate the American economy from its global peers. While cycles of volatility, rotation, and policy debate are inevitable, they do not alter the structural advantages that drive long-term growth. Capital investment, technological leadership, and entrepreneurial dynamism remain powerful engines that will shape the next decade, not the next quarter. For investors willing to look beyond short-term headlines, the U.S. continues to offer the most durable and compelling opportunity set in the global marketplace.
It is our aim at Asbury Wealth Partners that you find the market commentary we provide informative and useful. As our success grows mainly through referrals from our clients, we encourage you to share this weekly newsletter with your friends, family, and colleagues. If you are a client, we thank you for your business and your confidence. If you are not yet a client, we encourage you to contact us today and explore how our team may be able to add value to your unique financial situation.
Thank You,
Jeff
~~~~~~~~~~~~~~~~~~~~~~~
Jeffrey S. Markewich
Wealth Advisor
Off – 719-548-8103
Cell - 719-357-7747
Text – 702-493-9678
TF - 888-328-7655
www.CreateClarity.US
~~~~~~~~~~~~~~~~~~~~~~~
An Introduction to Your Friends & Family
is the Greatest Compliment You Can Give
Jeffrey Markewich is a Registered Representative with, and securities and advisory services offered through LPL Financial, a registered investment advisor, Member FINRA/SIPC.
The information contained in this email message is being transmitted to and is intended for the use of only the individual(s) to whom it is addressed. If the reader
of this message is not the intended recipient, you are hereby advised that any dissemination, distribution or copying of this message is strictly prohibited. If you have received this message in error, please reply and you will be removed.
These views are those of the author, not of the broker-dealer or its affiliates. This material contains an assessment of the market and economic environment at a specific point in time and is not intended to be a forecast of future events, or a guarantee of future results. All investments involve risk, including loss of principal. Forward-looking statements are subject to certain risks and uncertainties. Actual results, performance, or achievements may differ materially from those expressed or implied. Information is based on data gathered from what we believe are reliable sources.
The NASDAQ Composite Index measures all NASDAQ domestic and non-U.S. based common stocks listed on The NASDAQ Stock Market. The market value, the last sale price multiplied by total shares outstanding, is calculated throughout the trading day, and is related to the total value of the Index.
S&P 500 – A capitalization-weighted index of 500 stocks designed to measure performance of the broad domestic economy through changes in the aggregate market value of 500 stocks representing all major industries.
The Dow Jones Industrial Average is comprised of 30 stocks that are major factors in their industries and widely held by individuals and institutional investors.
The Russell 2000 Index is an unmanaged index generally representative of the 2,000 smallest companies in the Russell 3000 index, which represents approximately 10% of the total market capitalization of the Russell 3000 Index.
The CBOE Volatility Index® (VIX®) is meant to be forward looking, showing the market's expectation of 30-day volatility in either direction, and is considered by many to be a barometer of investor sentiment and market volatility, commonly referred to as “Investor Fear Gauge”.
International investing involves special risks such as currency fluctuation and political instability and may not be suitable for all investors.
All indexes referenced are unmanaged. The volatility of indexes could be materially different from that of a client’s portfolio. Unmanaged index returns do not reflect fees, expenses, or sales charges. You cannot invest directly in an index. Consult your financial professional before making any investment decision.
There is no guarantee that a diversified portfolio will enhance overall returns or outperform a non-diversified portfolio. Diversification does not protect against market risk.
Asset allocation does not ensure a profit or protect against a loss.
The Consumer Price Indexes (CPI) program produces monthly data on changes in the prices paid by urban consumers for a representative basket of goods and services (Source: U.S. Department of Labor).
The Gross Domestic Product (GDP) is a comprehensive measure of U.S. economic activity. GDP measures the value of the final goods and services produced in the United States (without double counting the intermediate goods and services used up to produce them). Changes in GDP are the most popular indicator of the nation's overall economic health.
Government bonds and Treasury bills are guaranteed by the US government as to the timely payment of principal and interest and, if held to maturity, offer a fixed rate of return and fixed principal value.
LPL Tracking # 1058579