

Market Insights 1/13/26
Observations & Insights – January 13, 2026
Cars & Coffee is coming up this Saturday from 10am to Noon in our office parking lot, weather permitting.
Positive First Full Week of 2026
The major U.S. stock indexes produced gains of around 2% in the first full trading week of 2026. The S&P 500 and the Dow surpassed record highs set two weeks earlier, and the NASDAQ climbed to within 1.2% of its historic peak set more than two months ago.
Key Points
- Markets had a good first week of the year, generally a positive signal.
- Labor remains tight but is moving in the wrong direction according to the latest jobs report.
- Events in Venezuela illustrate geopolitical risk can rear up at any time.
- Low energy prices are disinflationary.
Observations: Markets Off to Fast Start
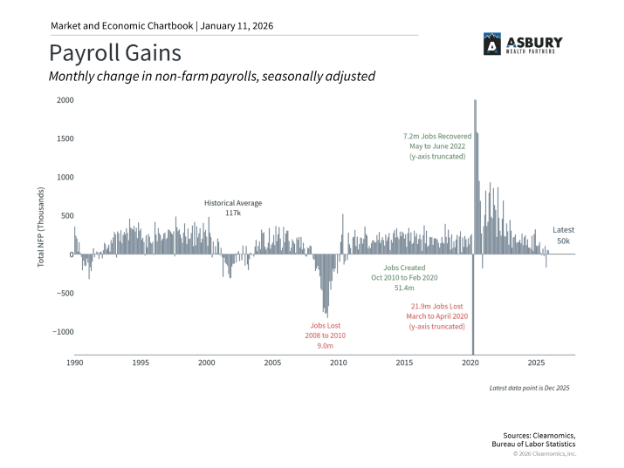
Friday’s jobs report provided further evidence of a labor market slowdown. The economy generated a below-forecast 50,000 jobs in December, and initial estimates for the previous two months were revised downward by a combined 76,000 jobs. In 2025, payroll gains averaged 49,000 per month, less than one-third of 2024’s 168,000 average.
A U.S. small-cap benchmark outperformed its large-cap peers by a wide margin and eclipsed a record high set four weeks earlier. The Russell 2000 Index added 4.6% for the week. Over the past month and a half, the index has added nearly 14%. Small-cap companies tend to be sensitive to the direction of interest rates as they generally carry outsized debt.
Precious metals prices rebounded from the previous week’s declines, extending rallies that began to pick up momentum in early 2025. Gold was trading above $4,520 per ounce on Friday afternoon and near a record level set two weeks earlier. Silver surpassed $80 per ounce for the first time on Tuesday and was trading just below that record level on Friday afternoon.
Oil prices fluctuated widely amid a heavy flow of geopolitical news affecting commodity markets. The price of U.S. crude fell to as low as $56 per barrel on Wednesday before rebounding to as high as $60 on Friday, resulting in a more than 3% weekly gain.
U.S. consumer sentiment is up for the second month in a row and at its highest level in four months, based on Friday’s preliminary monthly report from a University of Michigan survey. The index’s initial January reading was 54, up from December’s final figure of 52.9. Both results marked a modest rebound following a string of recent monthly declines amid weakening jobs growth.
The growth rate for dividend payments by U.S. companies accelerated in 2025’s fourth quarter. The $13.1 billion in net dividend increases recorded by companies in the S&P 500 was well above the previous quarter’s $10.6 billion, according to S&P Dow Jones Indices, which said it expects 2026’s first quarter to be a busy period for dividend increases due to record-high earnings and sales levels.
A Consumer Price Index report scheduled for release on Tuesday will show whether a recent downturn in inflation extended into December. The most recently released CPI report showed an annualized rate of 2.7% in November, well below economists’ consensus forecast for a 3.1% figure.
Insights: Jobs, Inflation & The Fed
December payrolls rose by 50,000 after downward revisions, but the three-month average fell to -22,000 from 232,000 at the start of last year, highlighting a clear cooling in hiring. The unemployment rate dipped slightly to 4.4%, suggesting the labor market remains relatively tight even as demand for workers softens. Hourly earnings grew 3.8% year over year, continuing to outpace inflation. Participation rates were little changed, reinforcing that weaker labor demand, not labor supply constraints, is the dominant trend.
This latest report by the Bureau of Labor Statistics confirms that the job market cooled significantly for the full-year 2025, with much slower job growth, rising unemployment, and several months of actual job losses for the first time since 2020. That said, it is important to maintain perspective since many other parts of the economy have been beating expectations.
Here are some key factors to consider:
• Job creation slowed dramatically in 2025, with only 584,000 jobs added for the year compared to 2.0 million in 2024. There were three months of negative job growth, the most since 2020. This means that the average job growth per month was only 49,000, far lower than the average of 168,000 in 2024. Because there was a significant negative revision to October (173,000 jobs lost), the monthly average over the fourth quarter of 2025 was a loss of 22,000 jobs.
• The unemployment rate finished the year at 4.4% but rose as high as 4.5% in November. While this was its highest level in over four years, it is still low by historical standards. Some data was delayed or unavailable due to the government shutdown in October and early November.
• The BLS revises these data each year, and the latest figures suggest there will be a major revision of 911,000 fewer jobs from the period of March 2024 to March 2025. This means the job gains were overstated over this period when they were initially reported.
• A separate report showed that job openings have declined to 7.1 million. This means that there are now fewer job openings than unemployed people, a reversal of the trend of the last several years. This suggests that companies may be hiring less due to economic uncertainty.
While a cooling job market creates near-term uncertainty, long-term investors should remember that economic cycles are normal, and markets have historically recovered from periods of weakness by focusing on fundamental growth drivers over time.
There’s Good News Too
The good news is that a key barometer for the labor market, the unemployment rate, went the other way. The unemployment rate fell from 4.6% to 4.4%, which is a historically low level. The unemployment rate did increase from 4.1% to 4.4% over the course of 2025, but that is not bad considering how weak the aforementioned payroll growth was. The fact that the unemployment rate did not rise even further tells you that the workforce has shrunk, amid a big pullback in immigration and the economy did not create a lot of jobs, but it created just enough jobs to keep up with population growth, which is why the unemployment rate did not rise even more.
In fact, the prime-age (25–54) employment-population ratio ended the year at 80.7%, near the highs we have seen this cycle and higher than at any point from 2002–2019. Prime-age workers are as close to full employment as we have seen over the past two decades.
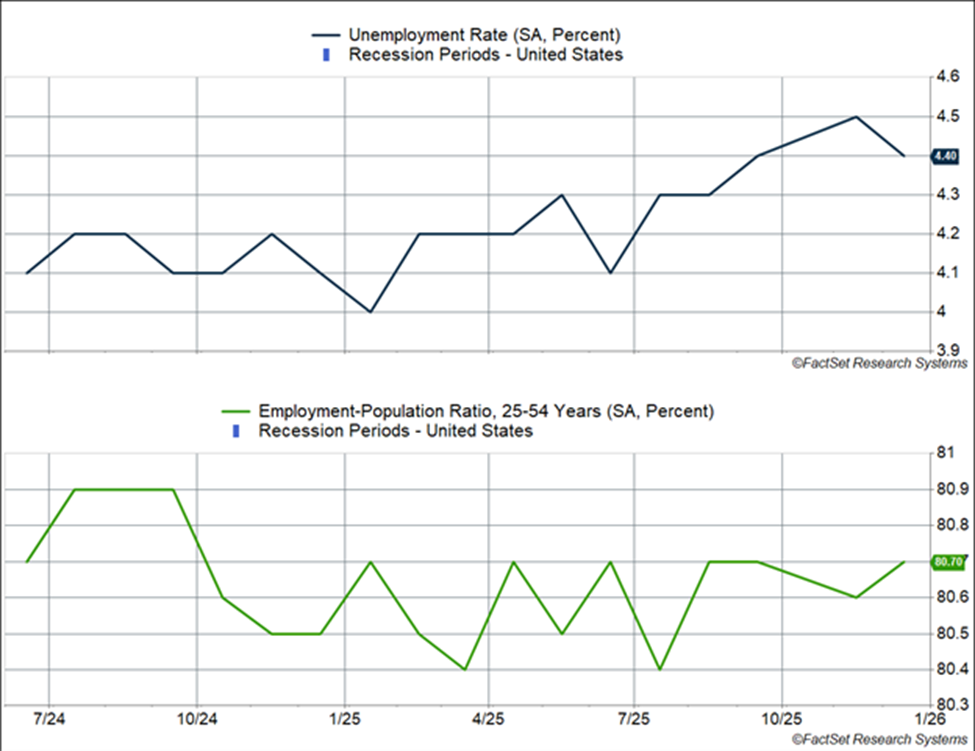
The higher participation rate for prime-age workers contrasts what happened for younger and older workers in 2025: it was a tough year, especially those looking for new jobs.
The unemployment rate for 16–19-year-olds rose from 12.3% to 15.7%.
- For 20–24-year-olds, it rose from 7.5% to 8.2%
The unemployment rate for the oldest cohort of workers (55+) fell from 3.1% in 2024 to 3.0% in 2025.
Note that this data can be quite noisy, but the trend is clear.

Source: FRED
This also gets to another related phenomena that happened in 2025. Despite weak hiring, output held steady. Real GDP growth across the first three quarters rose at an annualized pace of 2.3%, which is not far from the 2010-2019 trend (though lower than the near 3% pace in 2023-2024). That is a strong sign of productivity growth (producing the same amount of goods and services with fewer people).
Productivity growth clocked in at an annualized pace of 2.3% in 2025. It continues the positive productivity growth story from 2023-2024 (2.7% average), and over the last three years, productivity growth has run at an average of 2.5%. That is well above the 2005-2022 pace of 1.5% and is reminiscent of the above-average productivity growth from 1996-2004 (though that was higher still, averaging 3.1%).
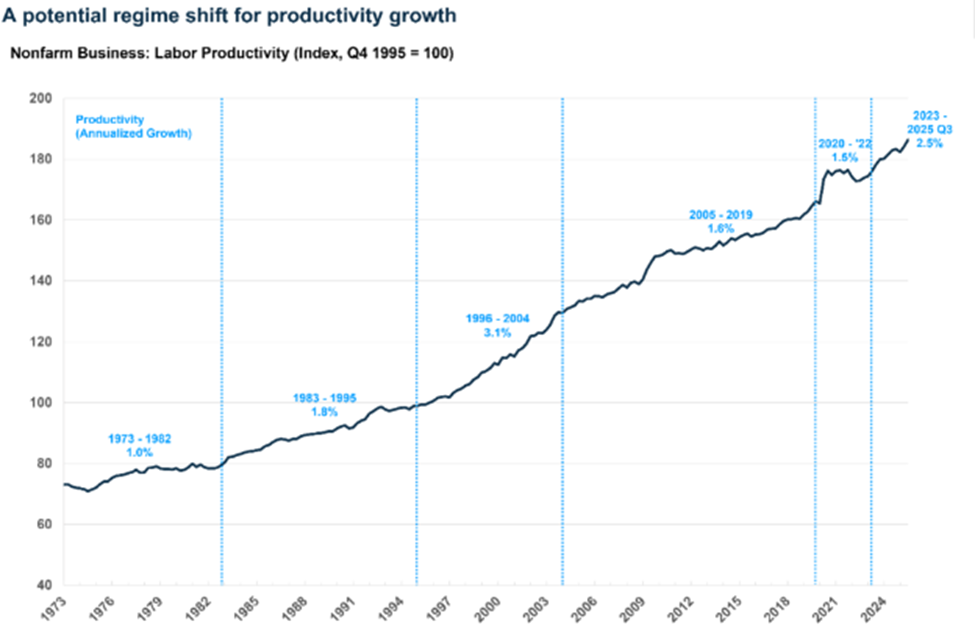
Source: FRED
It would be easy to attribute this to gains from artificial intelligence (AI), but while that could be a story for 2025, it was not the case in 2023 and 2024, when productivity growth was even higher. Instead, the productivity gains are probably related to the dynamics we are seeing in the labor market.
Companies likely over-hired workers in the 2021-2023 period and have now curbed hiring, especially in 2025, amid economic uncertainty and policy headwinds (like tariffs). Many firms cut costs by curbing their workforce through attrition by not replacing workers who left their jobs. This by itself leaves the existing workforce much more experienced, and productive (since new hires take a while to get up to speed, and that is a “cost,” at least temporarily). It also explains how firms continued to expand margins in 2025, in addition to raising prices even more than their input prices went up (which is why inflation remained elevated). Note that margin expansion also a key driver of the stock market last year.
But there is a problem at the aggregate level, even if not for individual companies. Companies can squeeze workers only so much. At some point they have to pay higher wages and hire more workers. Productivity growth is often accompanied by strong real wage growth for workers (wages adjusted for inflation), this happened in the late 1990s and even 2023-2024. But 2025 was odd because we got strong productivity growth and weak real wage growth (nominal wage growth eased and elevated inflation took a bite out of it). That can continue for only so long. Weak real wage growth can ultimately lead to weaker consumption and that will drive revenues and profits lower. Instead, I think we will see a pickup in both activity and hiring as 2026 gets underway (rather than a drop in consumption and a much weaker economy).
Brace for a pause in interest rate cuts?
We may have just seen the last cut by a Powell-led Federal Reserve, back in December. A labor market that looks less shaky, especially with an unemployment rate that remains historically low and strong participation (at least for prime-age workers), is not one that is likely to push Fed members to advocate for more cuts in the immediate future. In their summary of economic projections from December, the median Fed member expected the unemployment rate to end up at 4.5%. It ended the year at 4.4% (which is their projection for 2026).
Still, as I discussed above, the labor market is not sending an “all is well” signal exactly. Moreover, President Trump is likely to continue pushing for more cuts, which means he will nominate a new Fed chair (Powell’s term ends in May) that is in favor of rate cuts, a lot of them. Of course, the Fed Chair has just one vote of 12 on the committee and so there is likely to be drama as a tug of war between a dovish and hawkish factions.
Markets still expect two more rate cuts in 2025, taking the Fed policy rate to the 3.00-3.25% range, but the first cut is expected only after May. That is our base case as well, with a Fed that eventually tilts toward the dovish side.
Venezuela, Oil, and the Impact on Portfolios
You have likely seen recent news coverage about the arrest of Venezuelan President Nicolás Maduro by U.S. forces. This geopolitical development has captured headlines and raised questions about what it might mean for investments.
While the humanitarian consequences are most important, there are also questions about how this might affect financial markets. I wanted to provide some perspective on how we are thinking about this evolving situation. The short answer is that history shows us these events rarely have lasting market impact, even when they feel significant in the moment.
What Happened and Why It Matters
The U.S. military conducted an operation that detained Maduro on charges related to drug trafficking and corruption. There is a long history of U.S. involvement in Latin American countries, including in Panama exactly 36 years ago. The Biden administration had previously placed a bounty on Maduro, which was increased by the Trump administration last year.
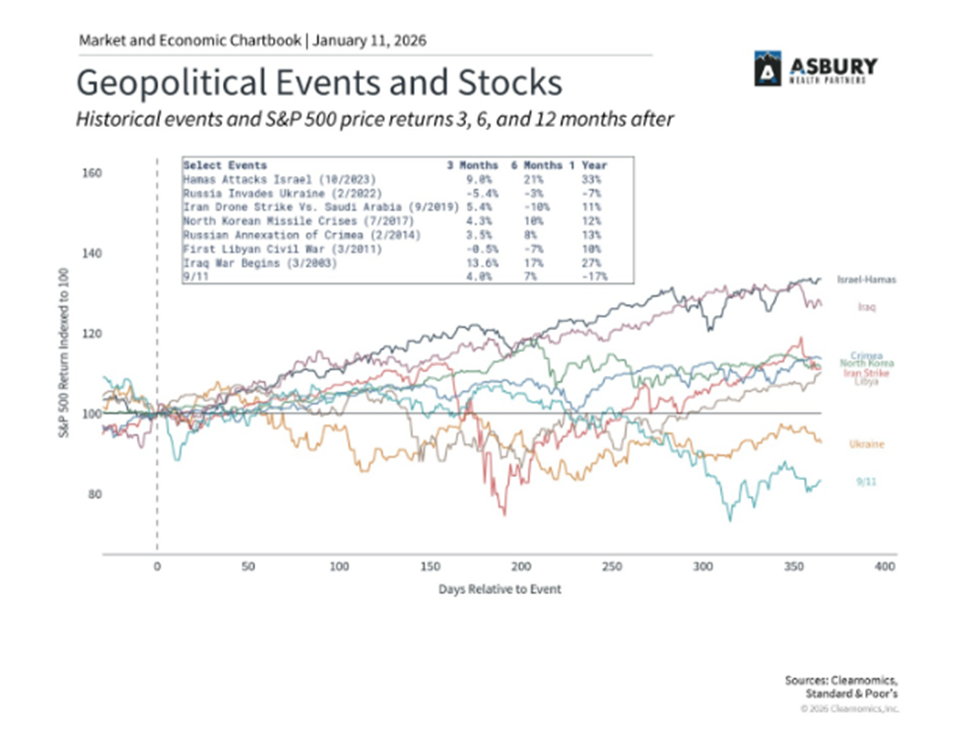
From an investor viewpoint, the most important lesson from history is that geopolitical shocks tend to create short-term volatility but do not typically change the direction of markets over the long run. We have seen this pattern repeatedly in recent years with conflicts in Ukraine and the Middle East. This is because geopolitical events can temporarily affect sentiment and commodity prices, but they rarely alter the underlying drivers in a lasting way.
The Oil Price Connection
President Trump has also stated that the United States will work to expand Venezuela's oil production. For context, Venezuela possesses the world's largest proven oil reserves, even more than Saudi Arabia. However, decades of mismanagement have reduced the country's oil production to less than 1 million barrels per day, compared to the U.S. at nearly 14 million.
The primary way geopolitical events affect investment portfolios is through commodity prices, particularly oil. This situation is different from Russia's invasion of Ukraine in 2022, which disrupted existing supply and pushed oil prices to nearly $128 per barrel. That crisis worsened inflation and sent gasoline prices above $5 per gallon.
In contrast, increased Venezuelan production would likely place downward pressure on oil prices over time, which could actually be positive for consumers and the broader economy. Current oil prices remain subdued, trading around $60 per barrel, well below historic peaks. Major U.S. oil companies may also benefit as they access these reserves, but this will also take time to play out.
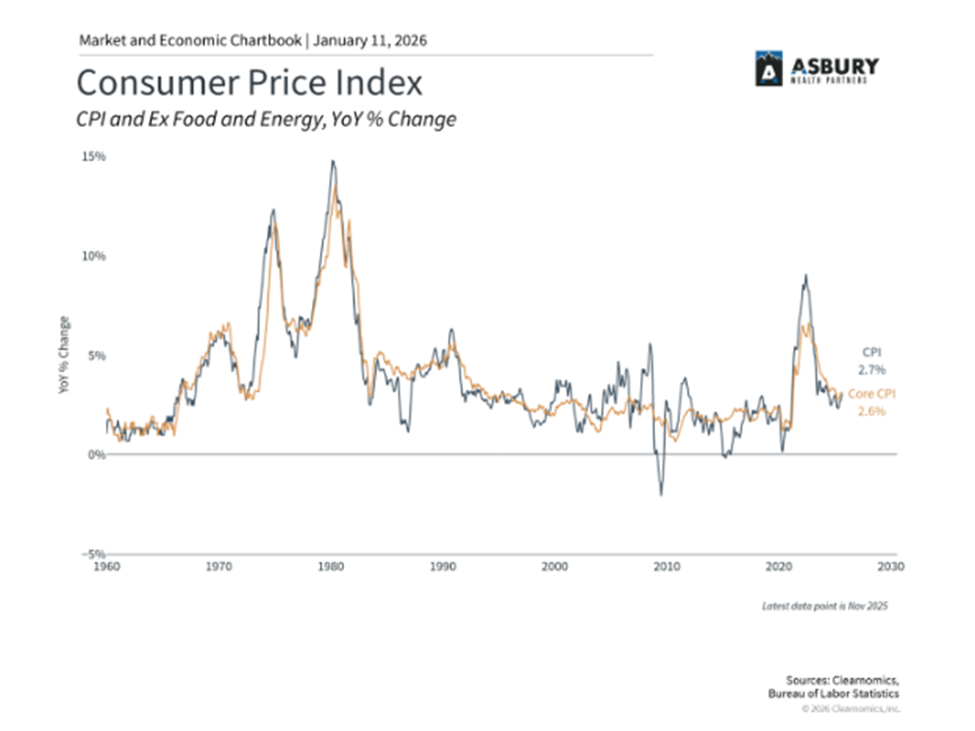
Oil prices play a significant role in shaping inflation because energy is a fundamental input across nearly every part of the economy. When oil prices rise, transportation costs increase, manufacturing becomes more expensive, and businesses often pass these higher costs on to consumers through higher prices for goods and services. This can create broad inflationary pressure beyond just gasoline and heating costs. However, because food and energy prices are highly volatile and can swing sharply due to weather, geopolitics, or supply disruptions, economists often look at “core” CPI, which excludes food and energy, to better gauge underlying inflation trends. Core CPI helps strip out these short-term fluctuations to reveal whether inflation pressures are becoming embedded in wages and broader pricing behavior. Still, sustained moves in oil prices eventually filter into core inflation over time, which is why energy markets remain a critical variable in the inflation outlook. Bottom line is lower energy prices eventually translate into lower inflation and lower costs for consumers.
Venezuela plays essentially no role in global financial markets. The country's stock market is small and illiquid, and it is not included in major emerging market indices. Most investors have minimal or zero direct exposure to Venezuelan stocks. Additionally, Venezuela has been in default on its bonds since 2017, so there is minimal exposure through fixed income markets.
The situation in Venezuela will continue to evolve, and there may be additional developments that capture headlines. Rather than trying to predict exactly how things will unfold, investors should focus on what can be controlled.
Geopolitical risk is a normal part of investing. What matters most is maintaining perspective and staying focused on long-term market trends and investors’ long-term goals rather than responding to short-term headlines.
It is our aim at Asbury Wealth Partners that you find the market commentary we provide informative and useful. As our success grows mainly through referrals from our clients, we encourage you to share this weekly newsletter with your friends, family, and colleagues. If you are a client, we thank you for your business and your confidence. If you are not yet a client, we encourage you to contact us today and explore how our team may be able to add value to your unique financial situation.
Thank You,
Jeff
~~~~~~~~~~~~~~~~~~~~~~~
Jeffrey S. Markewich
Wealth Advisor
Off – 719-548-8103
Cell - 719-357-7747
Text – 702-493-9678
TF - 888-328-7655
~~~~~~~~~~~~~~~~~~~~~~~
An Introduction to Your Friends & Family
is the Greatest Compliment You Can Give
Jeffrey Markewich is a Registered Representative with, and securities and advisory services offered through LPL Financial, a registered investment advisor, Member FINRA/SIPC.
The information contained in this email message is being transmitted to and is intended for the use of only the individual(s) to whom it is addressed. If the reader
of this message is not the intended recipient, you are hereby advised that any dissemination, distribution or copying of this message is strictly prohibited. If you have received this message in error, please reply and you will be removed.
These views are those of the author, not of the broker-dealer or its affiliates. This material contains an assessment of the market and economic environment at a specific point in time and is not intended to be a forecast of future events, or a guarantee of future results. All investments involve risk, including loss of principal. Forward-looking statements are subject to certain risks and uncertainties. Actual results, performance, or achievements may differ materially from those expressed or implied. Information is based on data gathered from what we believe are reliable sources.
The NASDAQ Composite Index measures all NASDAQ domestic and non-U.S. based common stocks listed on The NASDAQ Stock Market. The market value, the last sale price multiplied by total shares outstanding, is calculated throughout the trading day, and is related to the total value of the Index.
S&P 500 – A capitalization-weighted index of 500 stocks designed to measure performance of the broad domestic economy through changes in the aggregate market value of 500 stocks representing all major industries.
The Dow Jones Industrial Average is comprised of 30 stocks that are major factors in their industries and widely held by individuals and institutional investors.
The Russell 2000 Index is an unmanaged index generally representative of the 2,000 smallest companies in the Russell 3000 index, which represents approximately 10% of the total market capitalization of the Russell 3000 Index.
The CBOE Volatility Index® (VIX®) is meant to be forward looking, showing the market's expectation of 30-day volatility in either direction, and is considered by many to be a barometer of investor sentiment and market volatility, commonly referred to as “Investor Fear Gauge”.
International investing involves special risks such as currency fluctuation and political instability and may not be suitable for all investors.
All indexes referenced are unmanaged. The volatility of indexes could be materially different from that of a client’s portfolio. Unmanaged index returns do not reflect fees, expenses, or sales charges. You cannot invest directly in an index. Consult your financial professional before making any investment decision.
There is no guarantee that a diversified portfolio will enhance overall returns or outperform a non-diversified portfolio. Diversification does not protect against market risk.
Asset allocation does not ensure a profit or protect against a loss.
The Consumer Price Indexes (CPI) program produces monthly data on changes in the prices paid by urban consumers for a representative basket of goods and services (Source: U.S. Department of Labor).
The Gross Domestic Product (GDP) is a comprehensive measure of U.S. economic activity. GDP measures the value of the final goods and services produced in the United States (without double counting the intermediate goods and services used up to produce them). Changes in GDP are the most popular indicator of the nation's overall economic health.
Government bonds and Treasury bills are guaranteed by the US government as to the timely payment of principal and interest and, if held to maturity, offer a fixed rate of return and fixed principal value.
LPL Tracking # 847583-1