


Market Insights
Observations & Insights – February 9, 2026
Software Stocks Under Siege
U.S. stocks experienced their most volatile week in months as a sharp selloff in software and technology stocks early in the week gave way to a powerful Friday rally. The S&P 500 finished the week essentially flat, down just -0.1%, while the Dow surged 2.6% to close above 50,000 for the first time. The Nasdaq declined -1.9% for the week despite Friday's strong rebound, as concerns about AI disruption to the software industry sparked heavy selling before dip buyers returned.
Key Points
- Software stocks experienced their steepest selloff in years on AI disruption fears.
- The Dow hit a record high above 50,000 as investors rotated into value stocks.
- Markets staged a dramatic Friday rebound with the Dow surging over 1,200 points.
- Kevin Warsh was nominated as the next Federal Reserve chairman.
- Labor market data showed weakness with layoffs jumping to post-financial crisis highs.
- Sector rotation accelerated as investors moved from growth to value and cyclical stocks.
Observations: Technology Stocks Underperform While Earnings Shine
The technology sector faced intense selling pressure this week as fears mounted that artificial intelligence tools are moving from complementing software to potentially replacing it. The catalyst came from Anthropic's announcement of new capabilities in its Claude Cowork productivity tool, including plugins for legal, finance, and marketing work that can be deployed company wide. The WisdomTree Cloud Computing Fund plummeted nearly -20% year-to-date, with Tuesday and Wednesday marking the steepest two-day decline for the software sector in years.
Thus, U.S. large-cap value stocks have widened their year-to-date performance lead over growth stocks, marking a shift from the growth style’s dominance over recent years. A value benchmark finished 2.2% higher for the week while the growth index fell -2.0%.
The price of Bitcoin fell early Friday to as low as $61,000, a level that was less than half of its record high of about $126,000 set four months earlier. As of Friday afternoon, Bitcoin climbed back to around $70,000 and was down about -17% for the week. Other cryptocurrencies also fell precipitously as forced margin selling took hold.
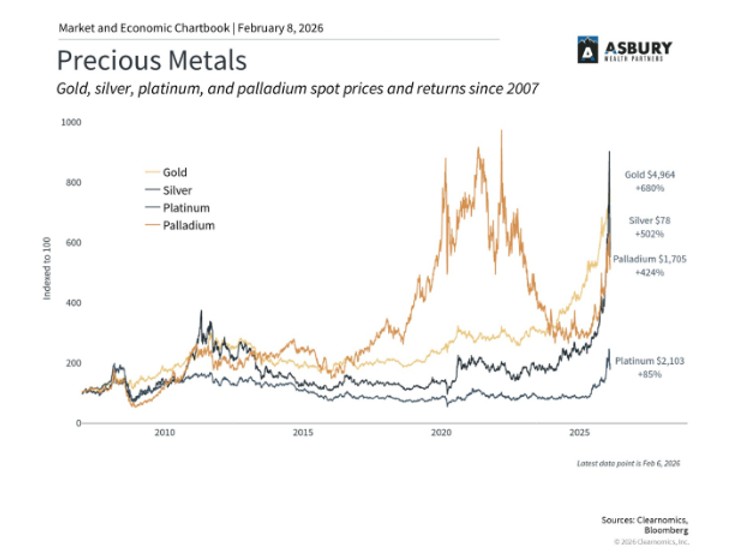
The recent trend of heightened precious metals price volatility continued, with gold rebounding from the previous week’s decline and silver retreating. Despite gold’s weekly gain, its price of around $4,980 per ounce on Friday afternoon was well below the record of nearly $5,586 reached on January 29. Silver was trading around $77 per ounce on Friday, down from a record $121 on January 29.
With earnings season more than half over, the information technology sector continues to dominate the broader market in earnings growth expectations. As of Friday, the tech sector was projected to post average fourth-quarter 2026 earnings growth of 30.4%, according to FactSet. That is more than double the 13.0% earnings growth projection for all 11 sectors across the S&P 500.
A measure of U.S. consumer sentiment rose to the highest level in six months. Friday’s preliminary survey reading from the University of Michigan Index of Consumer Sentiment was 57.3, up from a recent low of 51.0 three months earlier. Nevertheless, the measure was well below the 64.7 reading reached 12 months ago.
Investor sentiment is not quite as rosy, as last week’s selloff in software stocks led to a decline in sentiment from 56, or bullish, to 46, a neutral to bearish reading, according to the CNN Fear & Greed Index. The index is generally seen as a short-term barometer of sentiment and a contrarian indicator of longer-term market direction. The index hit a low for the week of 32 on Thursday.
Source: CNN
A partial U.S. government shutdown that ended on Tuesday prompted the U.S. Bureau of Labor Statistics to delay Friday’s scheduled release of its monthly jobs report and set a new release date of Wednesday, February 11. In addition, the Consumer Price Index (CPI) report on inflation was pushed back to Friday, February 13, two days after it had originally been scheduled.
Insights: Volatility, Rotation, and Opportunity
This week's violent swings in technology stocks represent more than routine profit-taking, they signal a potential inflection point in how investors assess the AI revolution. The debate has shifted from whether AI will transform industries to which companies will benefit and which will be disrupted. That distinction matters enormously. Software companies with sticky, mission-critical products embedded in complex workflows are likely to enhance their offerings with AI rather than be replaced by it. Those providing commodity services with lower switching costs could face genuine competitive threats.
Deutsche Bank drew parallels to the late 1990s dotcom era, noting that markets can absorb prolonged sector rotation without broad index stress, for a time. During the dotcom bubble's early deflation in 2000, consumer staples, utilities, and healthcare rallied significantly while tech declined, and the S&P 500 nearly reached new highs in September despite the tech carnage. The analogy is instructive but not determinative. Today's technology companies generate substantial cash flow, engage in buybacks, and pay dividends, behaviors almost completely absent in 1999. The current rotation may prove healthier and more sustainable than the dotcom bust.
The labor market data deserves close attention. Weakness emerging simultaneously with slowing inflation creates an environment conducive to Fed easing. Markets currently price in at most two rate cuts this year, with the benchmark rate landing around 3%, the level policymakers view as "neutral." However, if labor market deterioration accelerates while inflation continues moderating, the Fed may have room to move more aggressively than consensus expects. Kevin Warsh, despite his hawkish history, has recently expressed support for lower rates driven by productivity improvements. More on this below.
Market Action and Rotation
Friday's session delivered the week's most dramatic action. The Dow surged 1,232 points, or 2.6%, closing above 50,000 for the first time and notching its best day since May. The S&P 500 jumped 1.9%, also posting its strongest performance since May, while the Nasdaq climbed 2.1% for its best day since November. The rally came after the Nasdaq had shed more than $1.5 trillion in market value across the three prior sessions, its worst three-day stretch since April 2025.
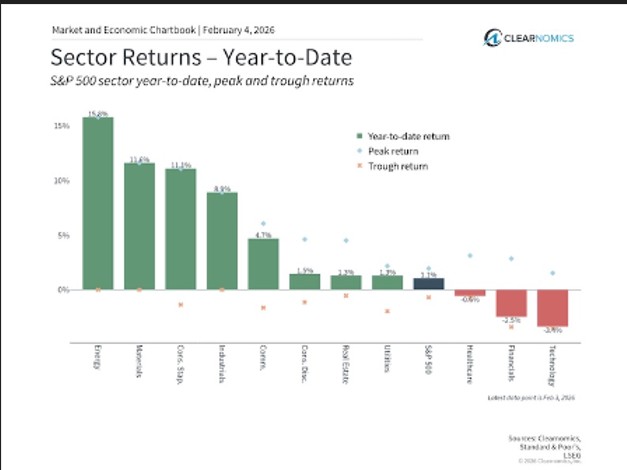
Beneath the surface, meaningful sector rotation took hold. Energy, materials, and industrials, sectors benefiting from AI infrastructure buildout, outperformed throughout the week. Small-cap stocks, as measured by the Russell 2000, gained 3.6% for the week, substantially outpacing large-caps. Cyclical names like Caterpillar gained 7.1% Friday, while Goldman Sachs climbed 4.3%. This rotation reflects investors seeking exposure to economically sensitive sectors rather than purely riding technology momentum. This would imply that we are still in early innings of the economic cycle and this kind of rotation is constructive.
Volatility indicators reflected the turbulence. The CBOE Volatility Index (VIX) spiked above 22 on Thursday, its highest level since November, before settling back to 17.76 on Friday, an 18% decline. Despite the weekly gyrations, the S&P 500 remained above its 200-day moving average, though it briefly dipped below both the 50-day and 100-day averages on Thursday for the first time since mid-November.
Sector rotation is now the dominant theme. With technology having led markets for three consecutive years of double-digit gains, some diversification into value, cyclicals, and economically sensitive sectors makes fundamental sense. Energy, materials, and industrials benefit from ongoing AI infrastructure buildout—the same trend that powered technology's gains but through different economic channels. Small and mid-cap stocks, which led in January, offer exposure to domestic economic strength without the same degree of AI disruption risk as large-cap software.
The technical picture, while shaken, remains constructive. The S&P 500 held its 200-day moving average and closed the week with 64% of components trading above their 50-day averages, solid breadth by historical standards. Friday's rebound demonstrated strong underlying buying interest, though whether it marks a sustainable low or merely a relief rally remains to be seen. Semiconductor stocks in particular look oversold on technical indicators, with 14-day relative strength indexes in historically attractive territory.
Labor Market Weakness Emerges
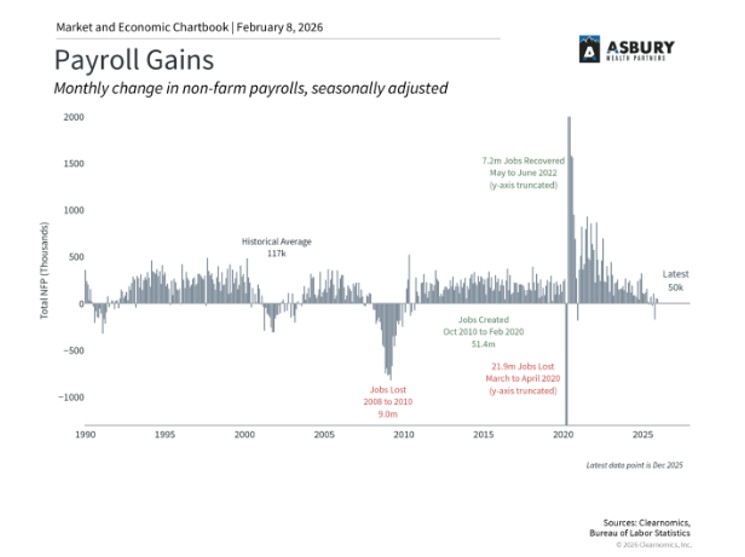
Economic data this week painted a concerning picture of the labor market. Outplacement firm Challenger, Gray & Christmas reported that U.S. employers announced 108,435 layoffs in January—the highest January total since the 2008 financial crisis. Job openings tumbled in December to 6.54 million, the lowest level since September 2020, and fell below the number of unemployed workers for the first time in years. The ratio of job openings to unemployed workers dropped to 0.87 to 1, down from over 2 to 1 during the pandemic peak.
Initial jobless claims for the week ended January 31 rose more than expected, adding to evidence that the labor market is cooling. These developments come as the Bureau of Labor Statistics prepares to release its January jobs report, which was delayed due to the recent partial government shutdown. Market participants are increasingly focused on whether this labor market softness will prompt the Fed to resume rate cuts sooner than previously anticipated.
New Fed Leadership on the Horizon
President Trump nominated Kevin Warsh to succeed Jerome Powell as Federal Reserve chairman when Powell's term expires in May. The 55-year-old Warsh previously served as a Fed governor from 2006 to 2011, making him the youngest appointee in Fed history at age 35. During his prior tenure, he was known as one of the more hawkish voices, at times opposing rate cuts during the 2008 financial crisis due to inflation concerns.
Warsh currently serves as a fellow at the Hoover Institution and lecturer at Stanford's Graduate School of Business. He has been vocal about his belief in "regime change" at the Fed, criticizing what he views as mission creep that has pushed the institution beyond its dual mandate of maximum employment and price stability. Interestingly, his recent commentary has favored lower policy rates, driven by optimism that productivity gains could support economic growth without stoking inflation, a position that aligns with President Trump's desire for rate cuts.
The nomination faces potential complications. Republican Senator Thom Tillis stated he will oppose any Fed nominee until the Department of Justice investigation into Powell is resolved, calling the probe based on "testimony that no reasonable person could construe as possessing criminal intent." Democratic Senator Elizabeth Warren similarly expressed concerns, framing the nomination as part of an attempt to politicize the central bank. With the Senate Banking Committee's narrow 13-11 Republican majority, Tillis has the ability to block a committee vote, though most observers expect Warsh will eventually be confirmed.
Final Thoughts
This week served as a reminder that bull markets do not move in straight lines. After three years of remarkable gains, technology stocks faced their first serious test of investor confidence in the AI era. The selloff, while painful for those concentrated in software, performed a valuable function: forcing more rigorous analysis of which companies will truly benefit from AI versus which face existential threats. Markets are now demanding that distinction, and that is healthy.
The rotation into cyclicals, value stocks, and small caps suggests investors see continued economic expansion rather than contraction. If recession were the concern, defensive sectors and bonds would be attracting flows. Instead, we see movement into economically sensitive areas that benefit from infrastructure investment and domestic growth. Combined with potential Fed easing as labor markets cool and inflation moderates, the setup remains constructive for equities, even if leadership continues shifting away from prior winners.
Volatility will likely remain elevated in the near term as earnings season continues and investors digest the implications of rapid AI advancement. However, the fundamental drivers, strong corporate earnings, productivity improvements, infrastructure investment, and potential monetary easing, continue pointing toward economic expansion. For long-term investors, periods of volatility and rotation create opportunities to rebalance portfolios and add exposure to temporarily depressed sectors. As we have emphasized before, the path forward may be bumpier than the road behind us, but the destination remains promising.
The Kevin Warsh nomination introduces both continuity and potential change. His Fed experience and market credibility provide reassurance, while his recent advocacy for lower rates aligns with the economic moment. Whether he can navigate the political pressures while maintaining central bank independence will define his tenure. For now, markets appear willing to give him the benefit of the doubt, focusing instead on the immediate question of when, not if, the next rate cut arrives.
It is our aim at Asbury Wealth Partners that you find the market commentary we provide informative and useful. As our success grows mainly through referrals from our clients, we encourage you to share this weekly newsletter with your friends, family, and colleagues. If you are a client, we thank you for your business and your confidence. If you are not yet a client, we encourage you to contact us today and explore how our team may be able to add value to your unique financial situation.
Thank You,
Jeff
~~~~~~~~~~~~~~~~~~~~~~~
Jeffrey S. Markewich
Wealth Advisor
Off – 719-548-8103
Cell - 719-357-7747
Text – 702-493-9678
TF - 888-328-7655
~~~~~~~~~~~~~~~~~~~~~~~
An Introduction to Your Friends & Family
is the Greatest Compliment You Can Give
Jeffrey Markewich is a Registered Representative with, and securities and advisory services offered through LPL Financial, a registered investment advisor, Member FINRA/SIPC.
The information contained in this email message is being transmitted to and is intended for the use of only the individual(s) to whom it is addressed. If the reader
of this message is not the intended recipient, you are hereby advised that any dissemination, distribution or copying of this message is strictly prohibited. If you have received this message in error, please reply and you will be removed.
These views are those of the author, not of the broker-dealer or its affiliates. This material contains an assessment of the market and economic environment at a specific point in time and is not intended to be a forecast of future events, or a guarantee of future results. All investments involve risk, including loss of principal. Forward-looking statements are subject to certain risks and uncertainties. Actual results, performance, or achievements may differ materially from those expressed or implied. Information is based on data gathered from what we believe are reliable sources.
The NASDAQ Composite Index measures all NASDAQ domestic and non-U.S. based common stocks listed on The NASDAQ Stock Market. The market value, the last sale price multiplied by total shares outstanding, is calculated throughout the trading day, and is related to the total value of the Index.
S&P 500 – A capitalization-weighted index of 500 stocks designed to measure performance of the broad domestic economy through changes in the aggregate market value of 500 stocks representing all major industries.
The Dow Jones Industrial Average is comprised of 30 stocks that are major factors in their industries and widely held by individuals and institutional investors.
The Russell 2000 Index is an unmanaged index generally representative of the 2,000 smallest companies in the Russell 3000 index, which represents approximately 10% of the total market capitalization of the Russell 3000 Index.
The CBOE Volatility Index? (VIX?) is meant to be forward looking, showing the market's expectation of 30-day volatility in either direction, and is considered by many to be a barometer of investor sentiment and market volatility, commonly referred to as “Investor Fear Gauge”.
International investing involves special risks such as currency fluctuation and political instability and may not be suitable for all investors.
All indexes referenced are unmanaged. The volatility of indexes could be materially different from that of a client’s portfolio. Unmanaged index returns do not reflect fees, expenses, or sales charges. You cannot invest directly in an index. Consult your financial professional before making any investment decision.
There is no guarantee that a diversified portfolio will enhance overall returns or outperform a non-diversified portfolio. Diversification does not protect against market risk.
Asset allocation does not ensure a profit or protect against a loss.
The Consumer Price Indexes (CPI) program produces monthly data on changes in the prices paid by urban consumers for a representative basket of goods and services (Source: U.S. Department of Labor).
The Gross Domestic Product (GDP) is a comprehensive measure of U.S. economic activity. GDP measures the value of the final goods and services produced in the United States (without double counting the intermediate goods and services used up to produce them). Changes in GDP are the most popular indicator of the nation's overall economic health.
Government bonds and Treasury bills are guaranteed by the US government as to the timely payment of principal and interest and, if held to maturity, offer a fixed rate of return and fixed principal value.
LPL Tracking # 1062394